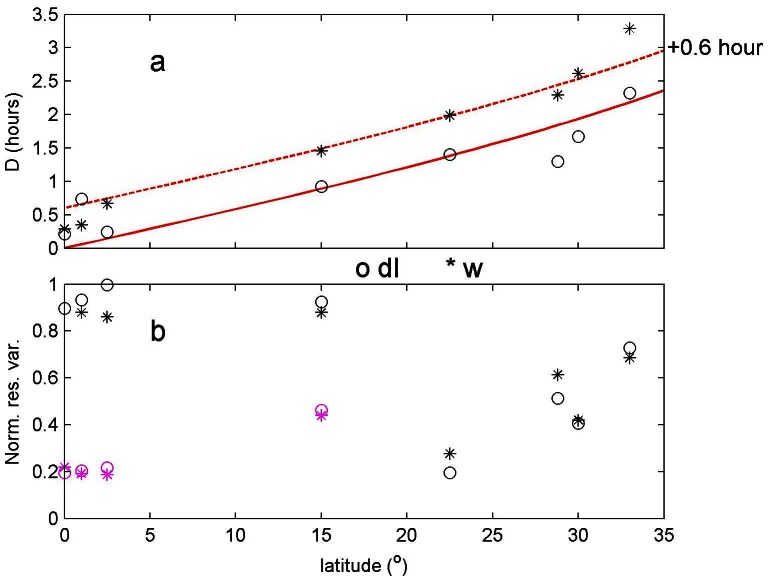
Figure 5. Latitudinal dependence of DVM-amplitude of seasonal variation in day length determined from (derivative of) daily relative dI-values (o, derivative of) and from daily w-values (*) around 1000 m (except 1400 m for mooring LOC113 at 33°N) using harmonic analysis on a one-year periodicity (single frequency of 1/365 cpd) for all moorings in Table 1.
(a) Day length amplitudes. The red graph indicates the suns variation in day length according to equation (2). The dashed red line indicates the same graph shifted by 0.6 hours (see text). Note that at 1000 m the average acoustics data residual is 77% (9.3 hours) of the sun's day length. (b) Normalized residual variance, following harmonic analysis. High values are expected near the equator, where a yearlong harmonic is expected to be small. For those data, vertical averages over 200 m were computed and an expected reduced “error” is indicated by purple symbols. Similarly, averages over 4 bins are computed for data from 15°N, which showed unexpected high normalized residual variance.

