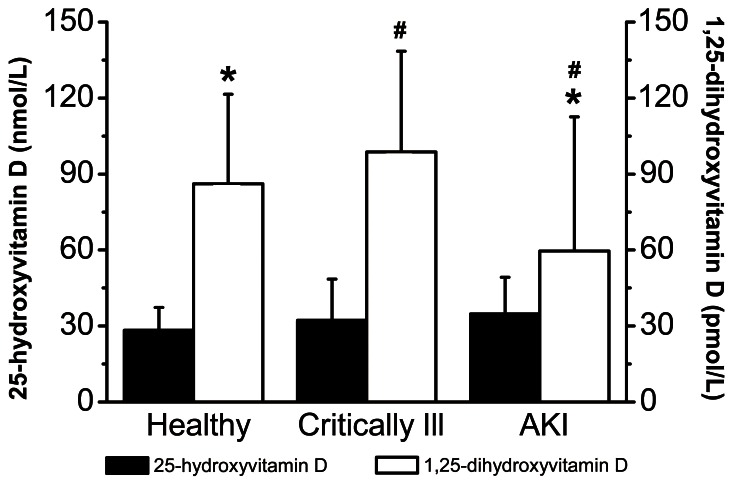
Figure 1. Vitamin D concentrations among healthy subjects, critically ill patients without AKI, and patients with AKI.
25-hydroxyvitamin D: ANOVA, p = 0.213. 1,25-dihydroxyvitamin D: ANOVA, p = 0.005. *p≤0.05, patients with AKI compared with healthy subjects. #p≤0.05, patients with AKI compared with critically ill patients. AKI, acute kidney injury; ANOVA, analysis of variance.

