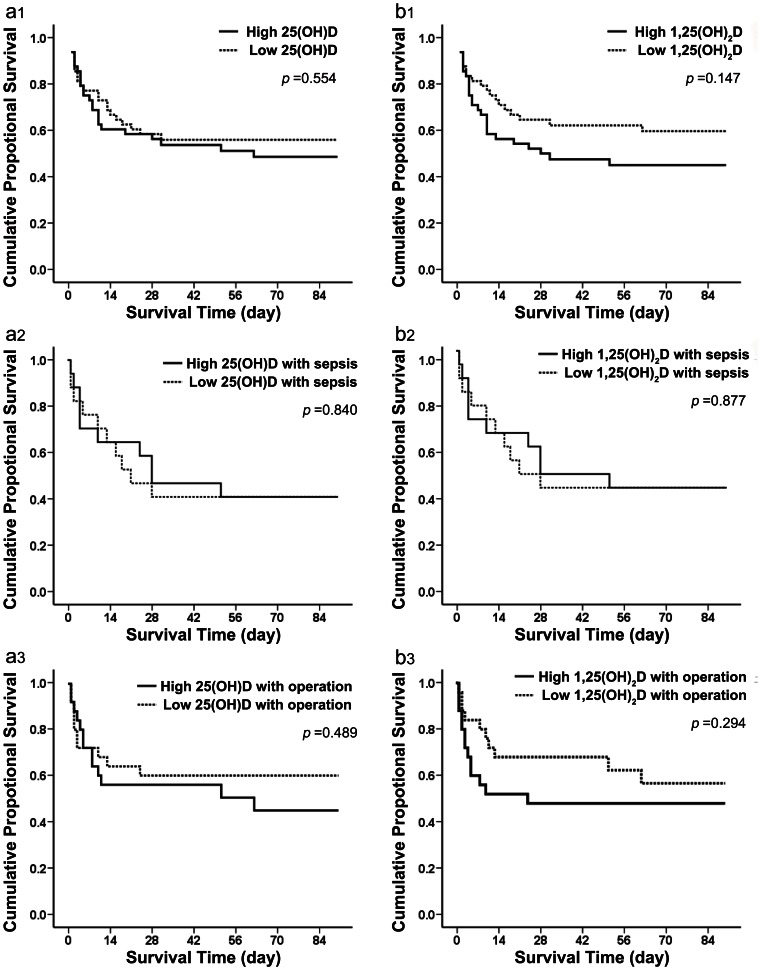
Figure 4. Ninety-day survival rate in patients with AKI with different vitamin D concentrations.
(a1) Failure plots for probability of survival at 90 days between high and low 25-hydroxyvitamin D level subgroups. No significant difference between the two subgroups was found (log rank, p = 0.554). (b1) Failure plots for probability of survival at 90 days between high and low 1,25-dihydroxyvitamin D level subgroups. No significant difference between the two subgroups was found (log rank, p = 0.147). (a2) Failure plots for probability of survival at 90 days between high and low 25-dihydroxyvitamin D level subgroups including patients with sepsis. No significant difference between the two subgroups was found (log rank, p = 0.840). (b2) Failure plots for probability of survival at 90 days between high and low 1,25-dihydroxyvitamin D level subgroups including patients with sepsis. No significant difference between the two subgroups was found (log rank, p = 0.877). (a3) Failure plots for probability of survival at 90 days between high and low 25-dihydroxyvitamin D level subgroups including patients with operations. No significant difference between the two subgroups was found (log rank, p = 0.489). (b3) Failure plots for probability of survival at 90 days between high and low 1,25-dihydroxyvitamin D level subgroups including patients with operations. No significant difference between the two subgroups was found (log rank, p = 0.294).

