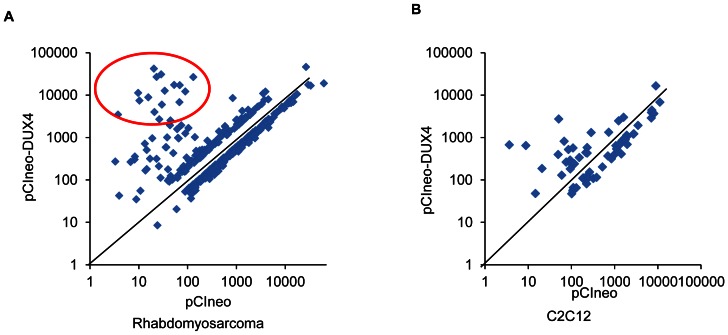
Figure 2. Scatter plot analysis of transcripts regulated by ectopically expressed DUX4 in RD and C2C12 cells.
To clearly visualize transcripts highly induced by DUX4, only transcripts changed >2-fold were used for analysis. Log transformed expression levels of transcripts in cells transfected with the insertless vector was plotted against expression levels of transcripts in cells transfected with the DUX4 expression vector. A cluster of transcripts highly induced by DUX4 (circled) in RD (A.) but not C2C12 cells (B.) was observed.

