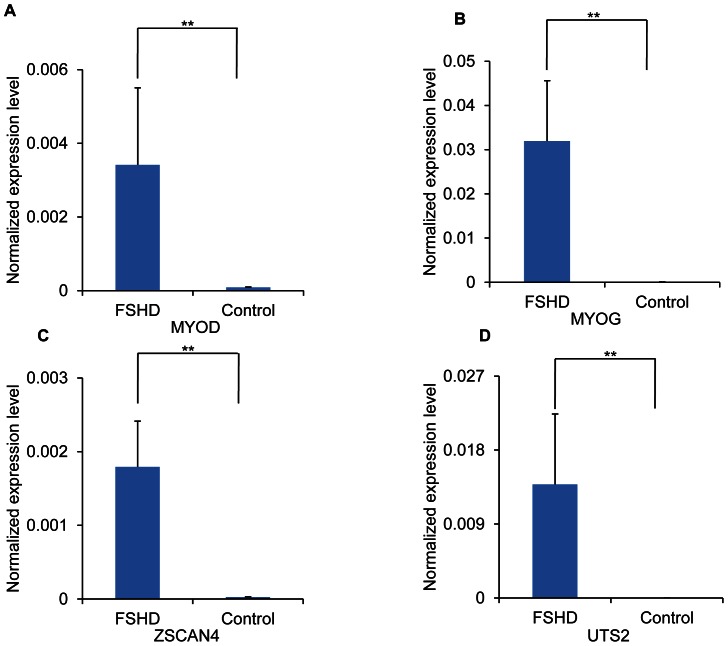
Figure 4. Up-regulation of MYOD, MYOG, ZSCAN4, and UTS2 in FSHD immortalized cells.
MYOD (A.), MYOG (B.), ZSCAN4 (C.), and UTS2 (D.) levels were quantified in FSHD immortalized cells and control cells using real-time qRT-PCR (n = 4). Values representing expression levels of transcripts were calculated using GAPDH as a reference. ** p<0.01.

