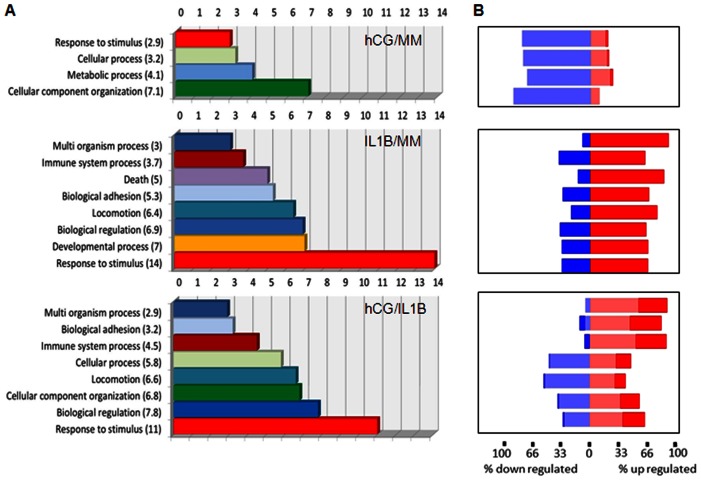
Figure 2. Enrichment score of biological processes.
A) GO analysis was used to identify the main biological processes targeted by gene lists and significantly modulated by each treatment. Each functional group was assigned with a GO enrichment score that was calculated using a chi2 test. B) A forest plot using the same gene list was also generated to show the percentage of differentially expressed genes that were up-regulated (red) or down-regulated (blue) for each biological process. Light color: gene populations with a fold change ranging from 1.5 to 2. Dark color: gene populations with a fold change above 2. Data were obtained with ESC cultures issued from 3 different subjects.

