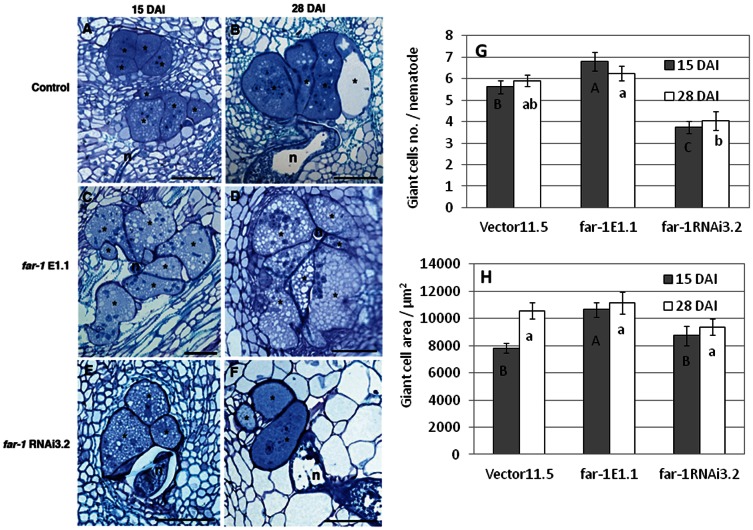
Figure 5. Longitudinal sections of M. javanica feeding sites in inoculated transgenic roots.
Histological analysis of roots expressing mj-far-1 (C, D) and mj-far-1RNAi roots (E, F) compared with vector control (A, B) were conducted at 15 and 28 DAI. At 15DAI giant cell systems were more developed and consists of more giant cells in roots where an excess of Mj-FAR-1 (G, H). Sections were stained with toluidine blue. * giant cell; n, nematode; Bar = 100 µm. The average of giant cell number at 15 and 28 DAI of 60 gall cross sections for each tomato hairy root line is presented (G). Giant cell area was measured on 50 giant cells. Measurements are represented by a mean ± standard error. Statistically significant differences (P≤0.05, analysis of variance) were determined by Tukey-Kramer multiple comparison tests. Different letters above the bars denote a significant difference.

