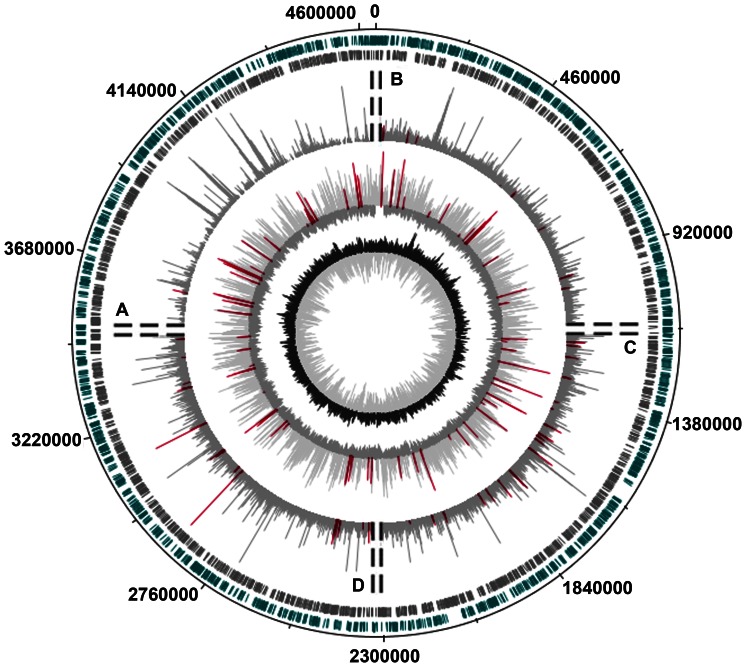
Figure 3. Distribution of transcriptional activity and RNAP binding sites in the genome of E.coli K12 MG1655.
The genomic map was created with the DNAPlotter [47]. The 1-st and the 2-nd outer circles show the distribution of genes transcribed from different strands. The 3-rd circle shows results of differential expression analysis (RNA-seq data [22]) reflecting the presence of different in size RNAs (plotted as log(N+1), where N is the number of registered sequence reads). The DNAPlotter sliding window was 10 bp, step – 10 bp. Since there was no asymmetry in the transcriptional activity of PIs along the genome, the results obtained for different in length RNAs were shown on one circle divided into 4 sections. A: 44 bases - long sequence reads (productive synthesis); B: samples, which sequences at the 5′-ends match the genome for at lest 14 or 13 bases; C: the same as B for 12 and 11 bases; D: the same as B for 10 and 9 bases. Sequence reads with multiple matching to the genomic DNA were taken into account. The 4th circle shows the distribution of RNAP binding sites (log2 ratio of hybridization signals, window 300 bp, step 300 bp), revealed by the chip-on-chip technique (experiment B in ref. [34]). Magenta bars mark products transcribed from PIs and hybridization signals within PIs. The central circle shows the local GC-content (window size 300 bp, step 300 bp).

