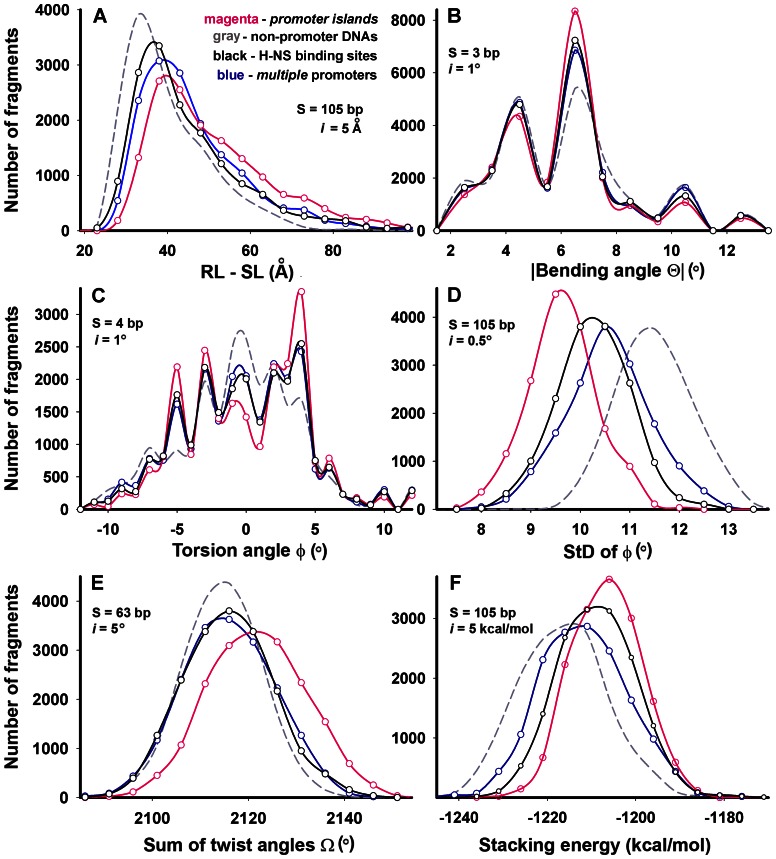
Figure 5. Histograms representing results of structural analysis.
Metric parameters (specified under X-axes) were obtained using the carbon (B, C and D) or phosphorus (A, E, and F) chains. Studied genomic regions and the colors used are indicated in the panel A. The number of fragments that have similar values of the measured parameters were combined in the intervals “i”, which are indicated in panels. Parameters RL-SL, Ω and stacking energy were measured for fragments of different lengths in the range 20–200 bp. Observed dependences were exemplified for fragments of indicated length (S).

