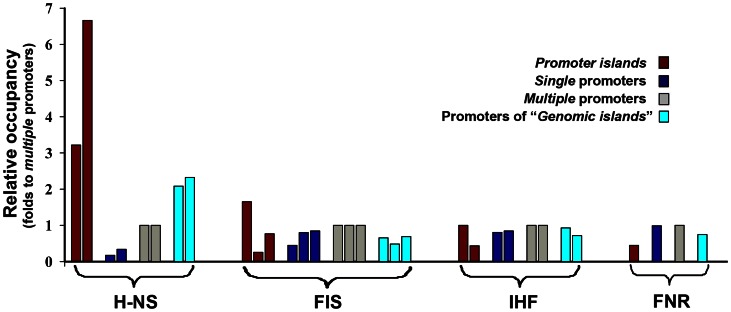
Figure 6. Relative occupancy of PIs and normal promoters by DNA-bound proteins.
The plot shows the relative number of PIs (magenta bars), single (blue bars) and multiple (gray bars) promoters, as well as promoters of alien genes (cyan bars) involved in interaction with H-NS, Fis, IHF and FNR according to the published chip-on-chip data [34]–[36], [40], [41]. First we evaluated the percentages of PIs and promoters of all categories, which interacted with a given protein, and then expressed them as fold ratio to the percentages of multiple promoters. The first bar in each group represents the data obtained for cells grown in Luria-Bertani medium [35], [40]; the second bar – M9 medium+fructose [36], [37]; the third bar on the Fis plot - M9 medium+glucose [41]. FNR binding was assessed using the cells grown anaerobically in M9 medium+fructose up to the mid-log phase [37]. Publications [35], presented data obtained from cells harvested at different growth stages. We combined them in order to account all the binding sites.

