
Figure 1. The relationship of total phanaeine species richness (blue dots/solid line), species richness of ecoregional endemics (red squares/solid line) and proportion of ecoregional endemics (green crosses/dashed line) with elevation.
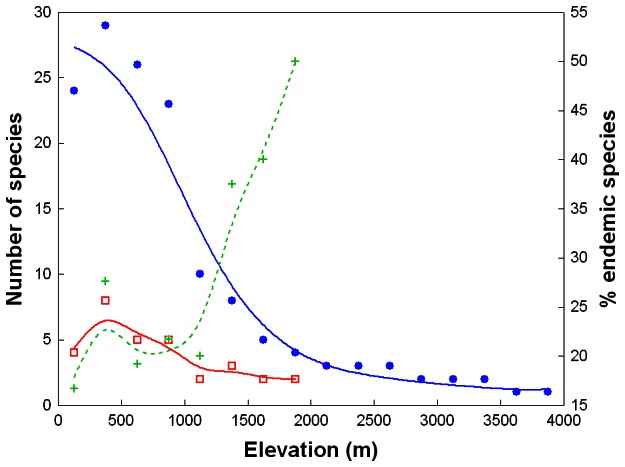
Curves were fitted by distance-weighted least squares smoothing.