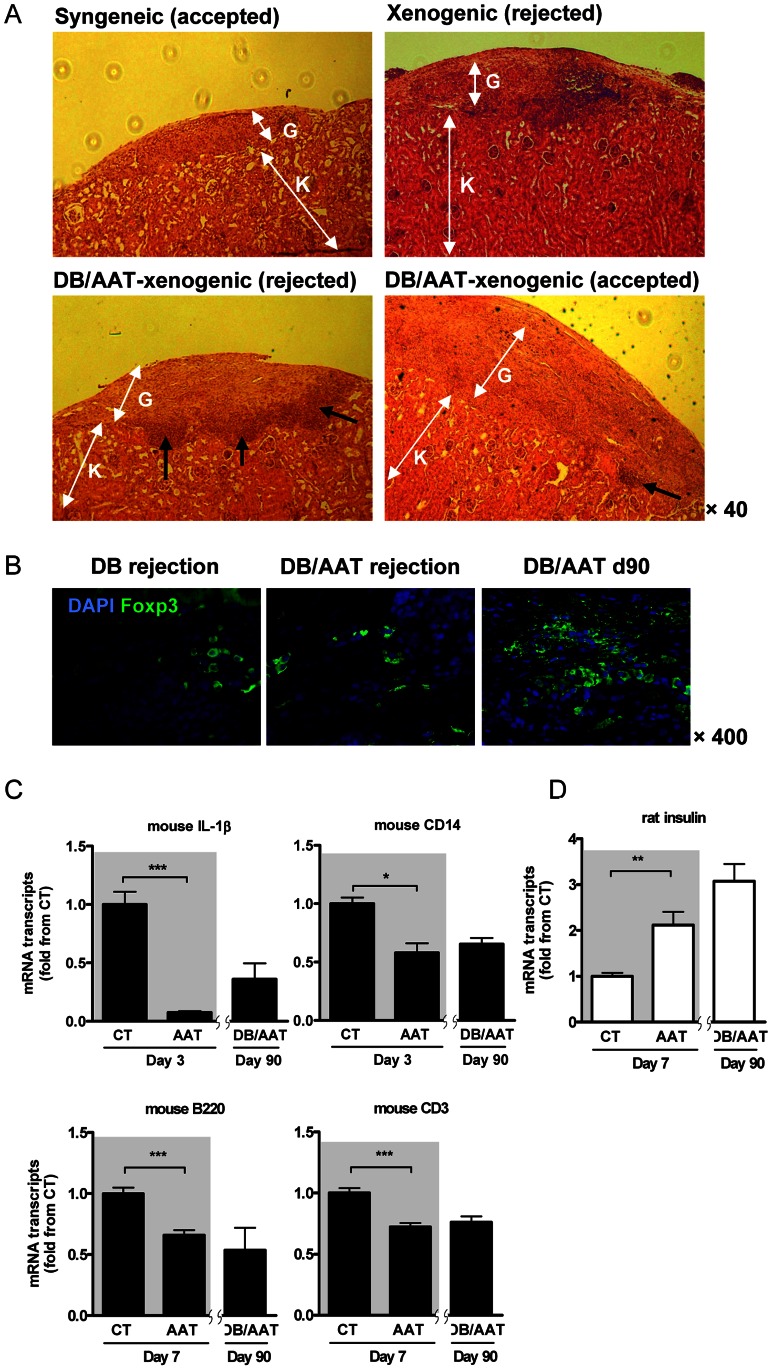
Figure 4. AAT treatment combined with debulking therapy; histology and gene expression.
Rat islets were grafted into mice that were treated with anti-CD4/CD8 depleting antibodies, in the absence of AAT therapy (n = 7) or with added AAT therapy (n = 5), as in Figure 3B. (A) Graft site histology. K, kidney tissue; G, graft site. From left to right, representative syngeneic mouse islet graft (day 35), xenograft (debulking therapy alone, day 25), black arrows indicate immune cell mononuclear infiltration, xenograft (debulking therapy combined with AAT, day 11 after rejection) and xenograft (debulking therapy combined with AAT, day 90). (B) Treg cell content in xenograft sites. Immunofluorescent staining. DB, debulking therapy alone (rejected graft); DB/AAT, combined debulking and AAT therapy (rejected and accepted grafts). Green, foxp3; blue, DAPI nuclear counterstaining. Representative images. (C) Mouse (recipient) gene expression profiles. RT-PCR. CT vs. AAT monotherapy, see Figure 1C, shown over gray background, next to day 90 explants from mice treated by the combination of debulking therapy and AAT (DB/AAT). Results expressed as fold change from CT, mean ± SEM from n = 3/group; *p<0.05, **p<0.01, ***p<0.001. (D) Rat (donor) insulin expression profile. RT-PCR. CT vs. AAT monotherapy, see Figure 1D, are shown over gray background, next to day 90 explants from mice treated by the combination of debulking therapy and AAT (DB/AAT). Results expressed as fold change from CT, mean ± SEM from n = 3/group; **p<0.01.

