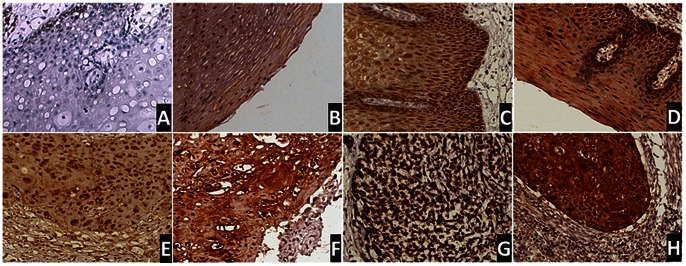
Figure 1. Representative IHC of maspin in matched normal and esophageal squamous cell carcinoma tissues.

Top: (A) normal esophageal tissue with negative, (B) weak, (C) moderate, and (D) strong maspin staining. Bottom: (E) ESCC with weak overall maspin expression, (F) moderate overall maspin staining, (G) overall strong maspin staining, which is distributed more to the nucleus, and (H) overall strong maspin staining, which is distributed more to the cytoplasm. x200.
