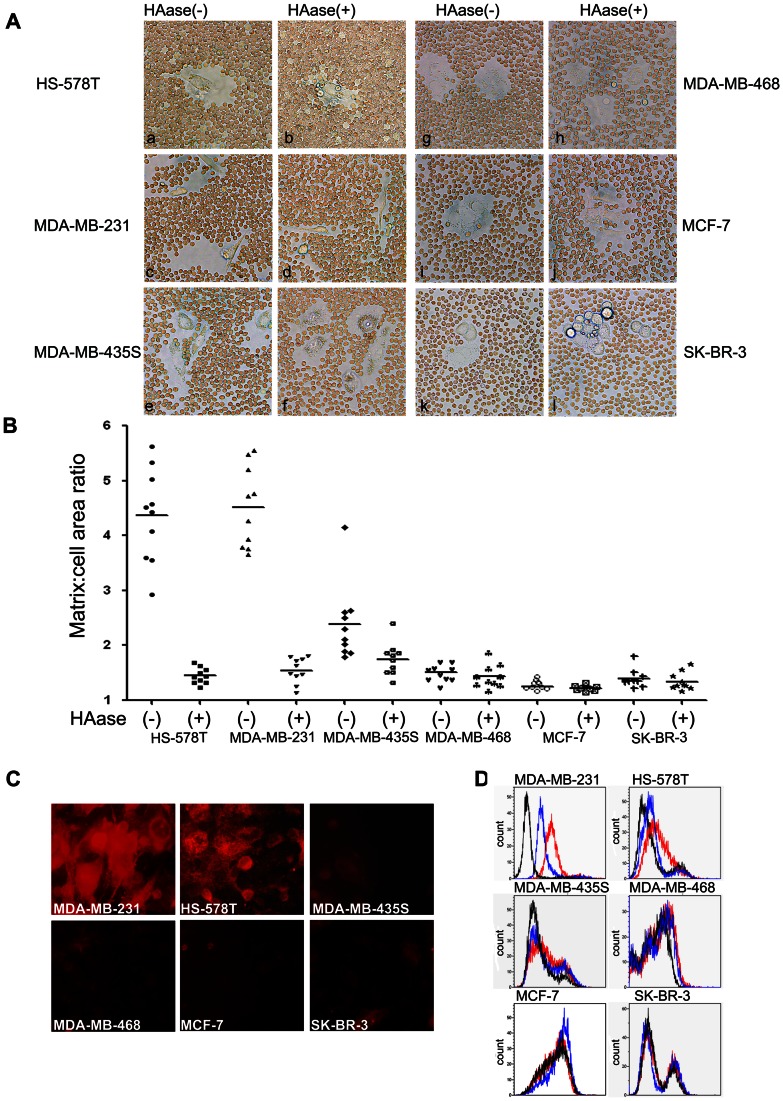
Figure 1. Breast cancer cell surface HA content was detected using three methods.
(A) Visualization and morphometric analysis of HA matrices were performed using a particle-exclusion assay before and after the addition of HA-specific Streptomyces hyaluronidase. A clear zone was apparent between HS-578T, MDA-MB-231 cells and red blood cells (a, c); approximately 5 min after Streptomyces hyaluronidase was added to the cells, the HA coats were degraded, allowing the red blood cells to contact the HS-578T and MDA-MB-231 cells (b, d). No difference before (e, g, i, k) and after (f, h, j, l) the addition of Streptomyces hyaluronidase to MDA-MB-435S, MDA-MB-468, MCF-7, and SK-BR-3 cells was observed. (B) Surface HA retention was quantified as the ratio of matrix area to cell area. Individual breast cancer cells were traced using Image Pro Plus 6 at the boundary of the clear zone to calculate the matrix area and at the cell perimeter to calculate the cell area. Coat/cell area ratios are plotted as a distribution, with the mean value represented by a horizontal bar. (C) An immune cell fluorescence experiment was used to detect cell surface HA. The relative brightness represented the HA content on the cell surface. Strong light was visualized in HS-578T and MDA-MB-231 cells; the light of the other four cell types was basically undetectable. (D) HA content was also assessed by FACS analysis. Representative histograms are shown for cells stained with biotinylated HABP and Alexa 488-labeled avidin to HA in untreated cells (red) or cells treated with Streptomyces hyaluronidase (blue). Control cells were stained only with Alexa 488-labeled avidin (black).

