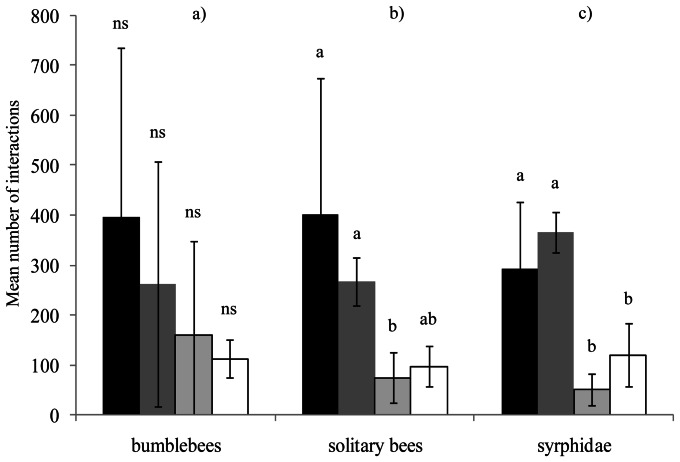
Figure 4. Mean number of flower interactions according to the landscape context.
a) bumblebees. b) solitary bees c) Syrphidae. Black bars: semi-natural context; dark grey bars: agricultural context; light grey bars: suburban context; white bars: urban context. Lines above bars denote 95% confidence interval. Bars that do not share the same letter show significant differences (P<0.05). NS: no significant differences (P>0.05).

