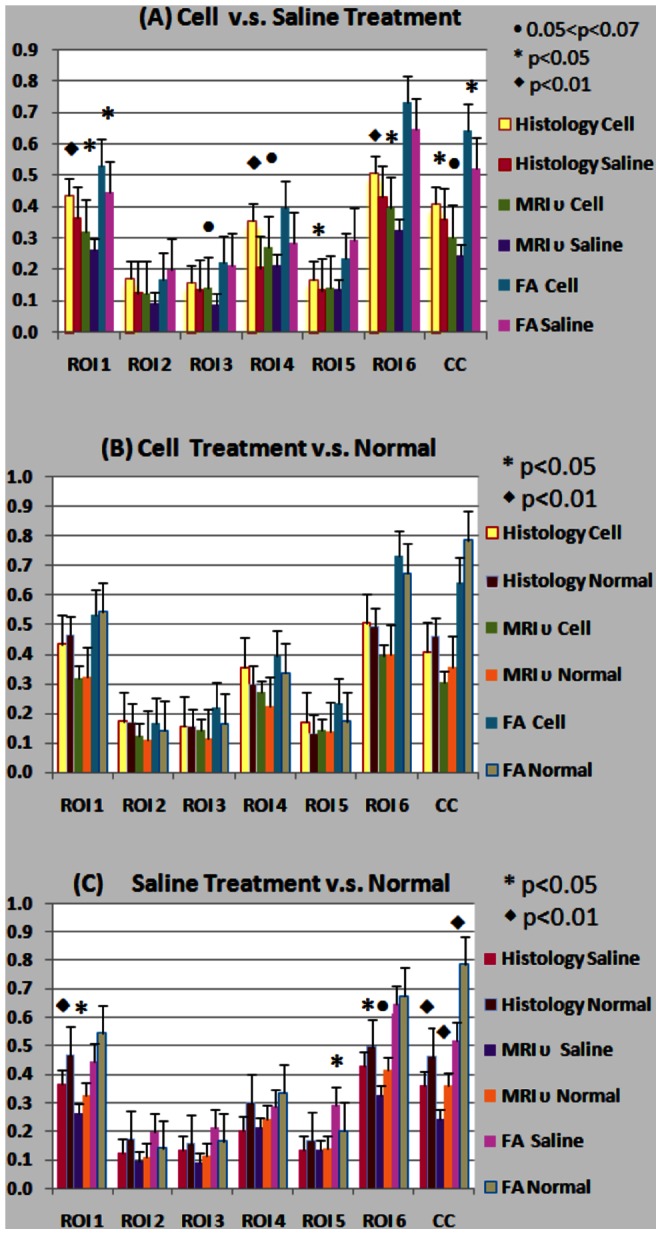
Figure 4. Direct comparison between histological and MRI neurite densities and FA between hMSCs treatment (n = 9) and Saline-treatment groups (n = 6) (A), hMSCs treatment and normal healthy groups(n = 5) (B), and Saline treatment and normal healthy groups in TBI lesion side ROIs.