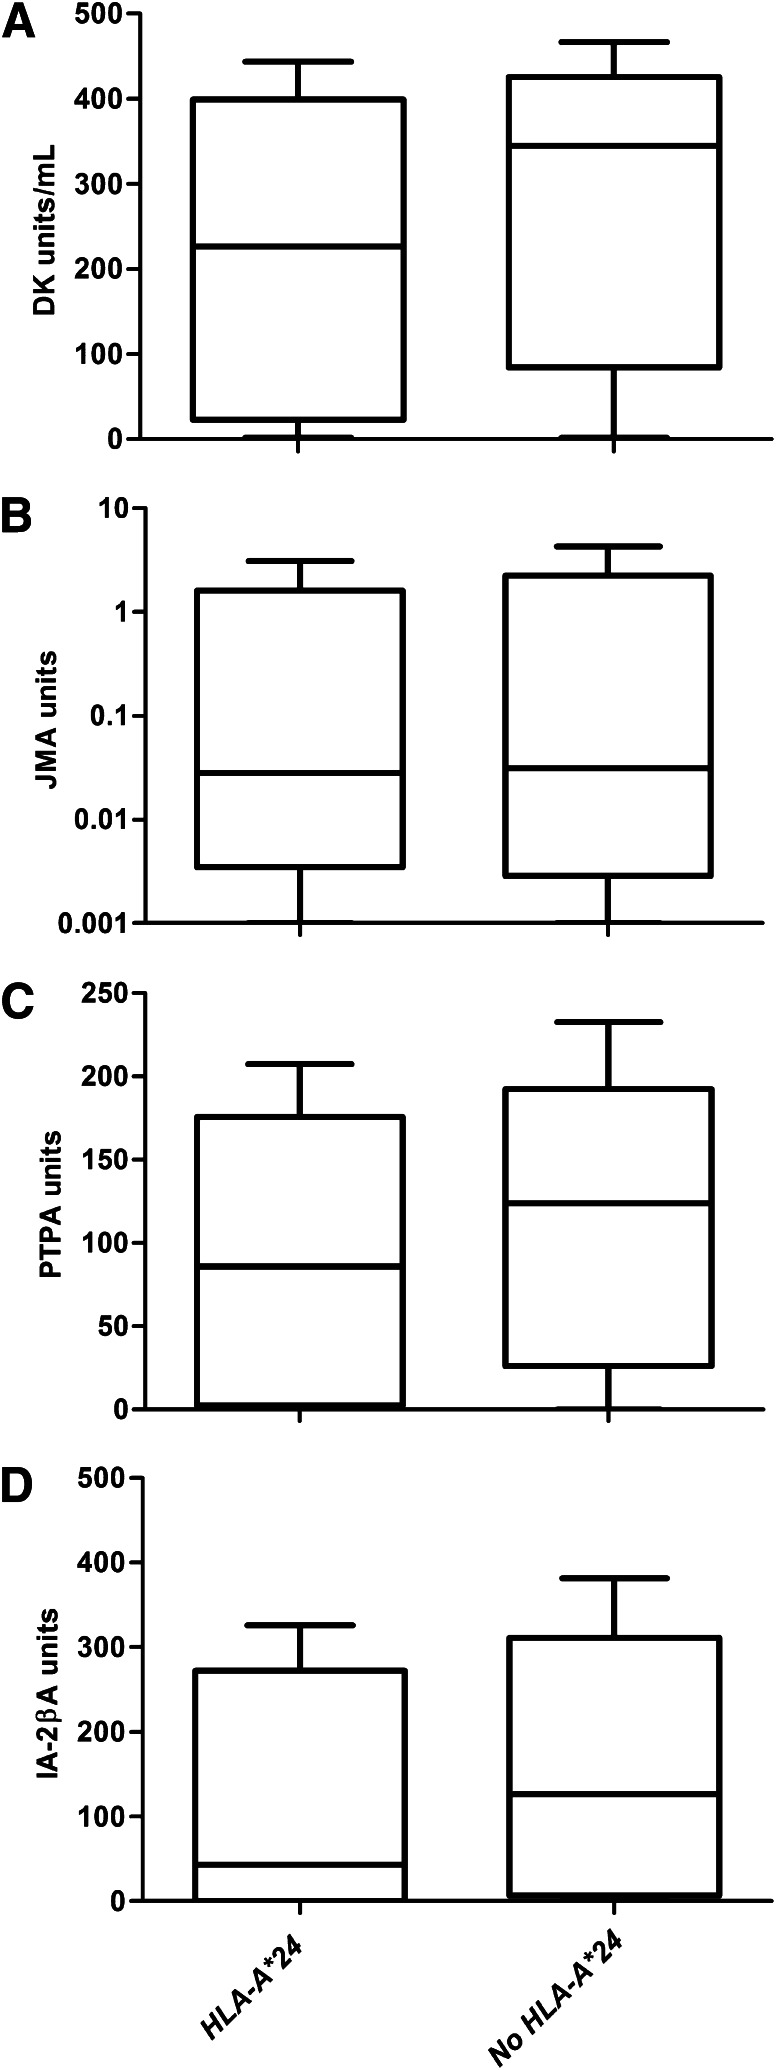
FIG. 1.
Box plots show the differences in autoantibody epitope levels among 460 IA-2A–positive patients according to HLA-A*24 genotype (n = 77 with HLA-A*24 and n = 383 without HLA-A*24). IA-2A (P < 0.001) (A), JMA (P = 0.661) (B), PTPA (P = 0.022) (C), and IA-2βA (P = 0.003) (D). The horizontal line in the middle of each box indicates the median; the top and bottom borders of the boxes represent the upper and lower quartiles, respectively, and the whiskers represent lower or upper quartile ± 1.5 times the interquartile range.

