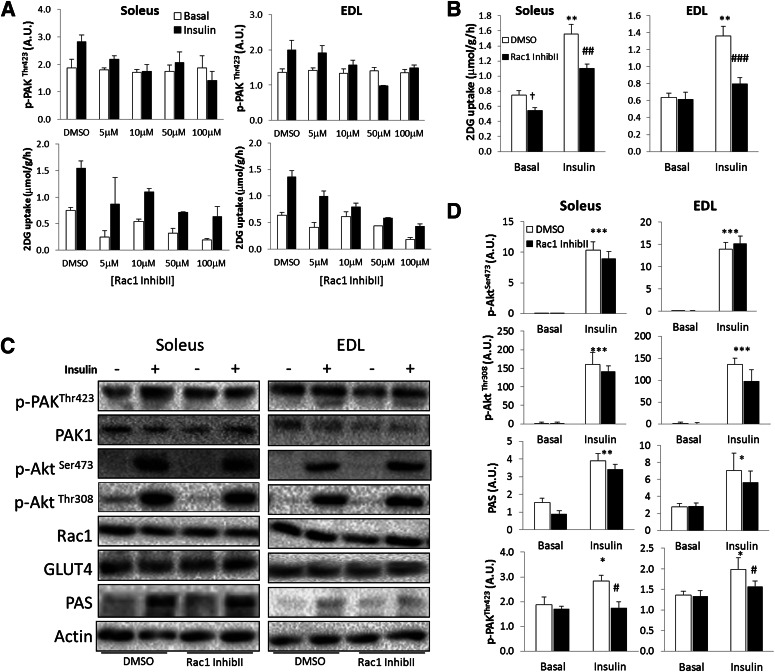
FIG. 2.
A: Bar graphs showing dose response of Rac1 Inhibitor II on insulin-stimulated p-PAKThr423 and 2DG uptake in soleus and EDL muscles. B: Insulin-stimulated (60 nmol/L, 30 min) 2DG transport in isolated incubated soleus and EDL muscles ± 10 μmol/L Rac1 Inhibitor II (InhibII) or a corresponding amount of DMSO, 40 min preincubation (n = 5–6). C: Bar graphs showing quantifications of p-PAKThr423, p-Akt Ser473, p-AktThr308, and PAS in soleus and EDL ± 10 μmol/L Rac1 Inhibitor II (n = 5–6). D: Representative blots showing insulin-stimulated signaling in soleus and EDL muscle ± 10 μmol/L Rac1 Inhibitor II. Statistically significant effects of the inhibitor on insulin-stimulated 2DG transport and signaling: #P < 0.05; ##P < 0.01; ###P < 0.001. Statistical significance between basal and insulin: *P < 0.05; **P < 0.01; ***P < 0.001. Main effect of inhibitor, †P < 0.05. Values are mean ± SEM.

