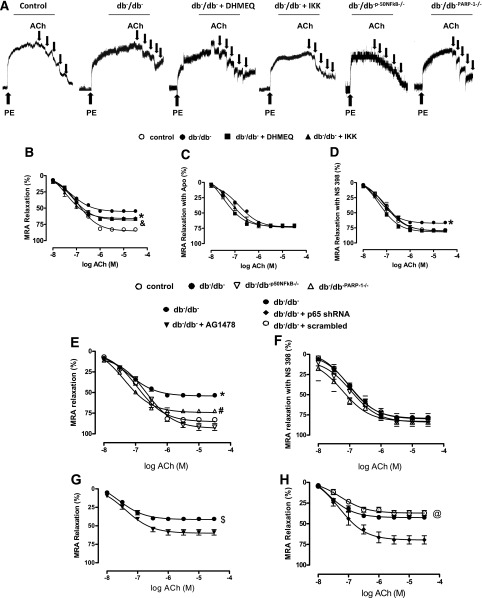
FIG. 3.
Effect of the NF-kB inhibition on EDR in MRAs. Key representative traces showing EDR curves to ACh from control and type 2 diabetic mice (db−/db−) treated with or without DHMEQ or IKK-NBD peptide, db−/db−p50NF-kB−/− mice, and db−/db−PARP-1−/−) mice (A). EDR in response to cumulative doses of ACh (10−8 to 10−5 mol/L) in MRAs precontracted with PE (10−5 mol/L) from control and db−/db− treated with or without DHMEQ or IKK-NBD peptide (B) and incubated with or without apocynin (Apo) (NADPH oxidase inhibitor) (C) or NS 398 (COX-2 inhibitor) (D). *P < 0.05 for db−/db− vs. control, db−/db− treated with DHMEQ or IKK-NBD. &P < 0.05 for db−/db− treated with DHMEQ or IKK-NBD vs. control. EDR in MRA from control, db−/db−, db−/db−p50NF-kB−/−, and db-/db-PARP-1−/− (E) and incubated with COX-2 inhibitor, NS 398 (F), and db−/db− incubated with either AG1478 (EGFRtk inhibitor) (G) or P65NF-kB shRNA lentiviral particles (H). *P < 0.05 for db−/db− vs. control, db−/db−p50NF-kB−/−, or db−/db−PARP-1−/−. #P < 0.05 for db−/db−PARP-1−/− vs. control, db−/db−p50NF-kB−/−. $P < 0.05 for db−/db− vs. db−/db− plus AG1478. @P < 0.05 for db−/db−, db−/db− plus scrambled vs. db−/db− plus p65 shRNA.

