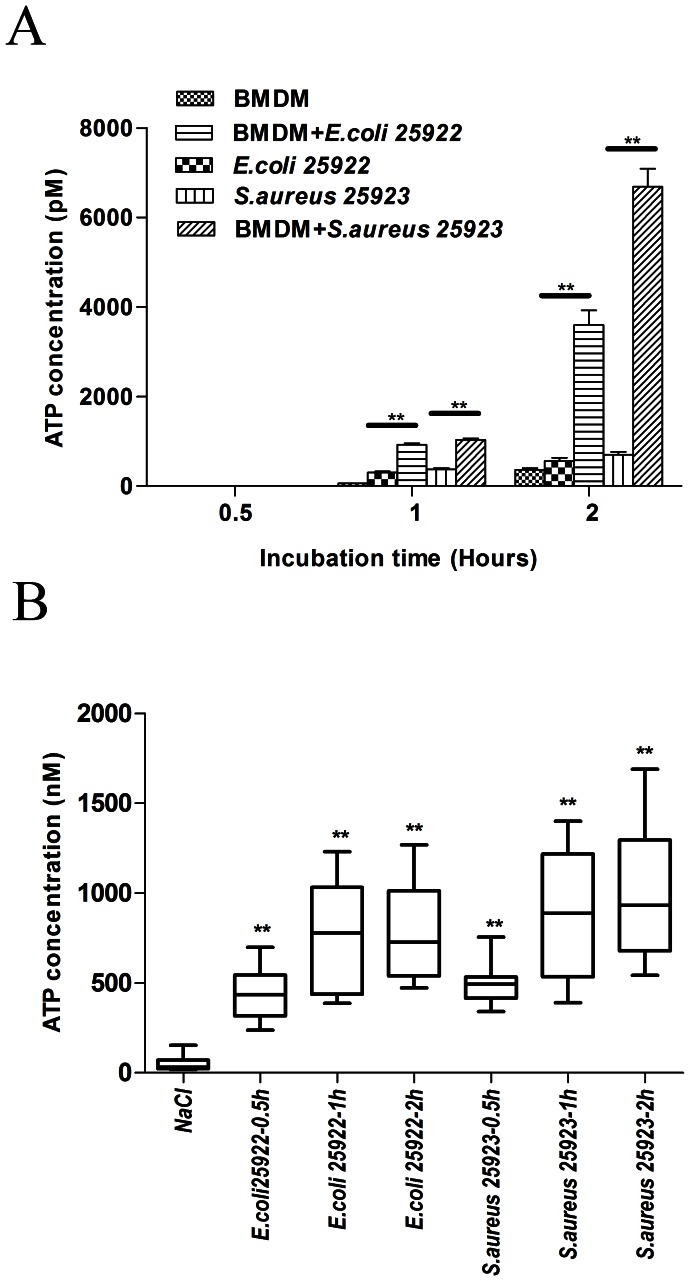
Figure 1. ATP was released after infection both in vitro and in vivo.
(A) In vitro analysis of ATP released from BMDMs and bacteria. The ATP levels in the culture medium from wells containing only cells, only bacteria (3×10⁸ CFU/ml) or both were assessed after 0.5, 1 and 2 hour of incubation. The data are presented as the means±SEMs (n = 5). (B) In vivo analysis of ATP release from murine peritoneal cells. Mice received intraperitoneal injections of E.coli 25922 (3×10⁸ CFU per mouse) or S. aureus 25923 (3×10⁸ CFU per mouse). The mice were sacrificed 0.5, 1 or 2 hours after injection. The peritoneal lavage fluid was harvested by injecting 2 ml of PBS into the peritoneum. The ATP concentration in the fluid was then assayed. As a negative control, 150 µl of 0.9% NaCl was intraperitoneally injected, and the peritoneal lavage fluid was harvested 2 hours after NaCl injection. The data are presented as the means±SEMs (n = 10). Values that are significantly different different are indicated by asterisks as follows: **, P<0.01.

