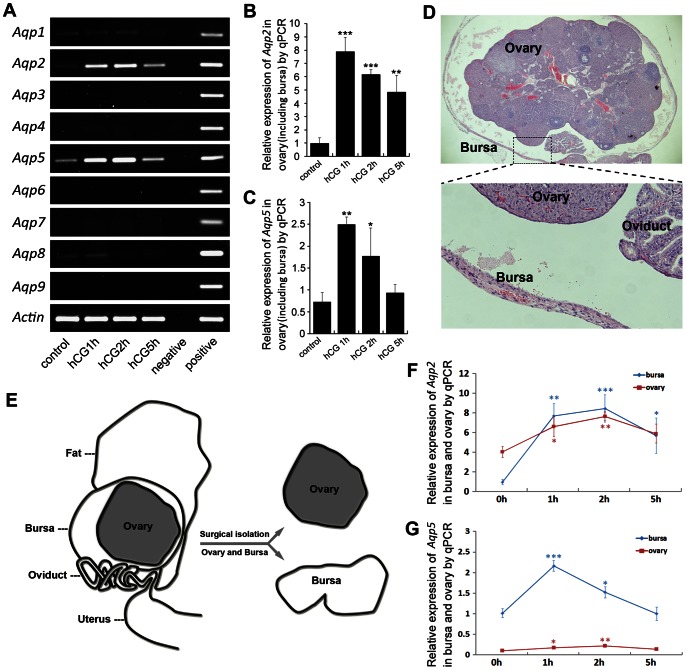
Figure 2. AQP2 and AQP5 transcripts showed temporal change correlating with the intra-bursa fluid dynamics.
(A) Expression profiles of aquaporin family members (Aqp1-9) after PMSG-primed hCG injection reveal dynamic changes of Aqp2 and Aqp5 in the ovary (containing encapsulating bursa). (B, C) Quantitative RT-PCR examinations of Aqp2 (B) and Aqp5 (C) expression. n = 3 for each time point. Error bars represent S.E.M., *P<0.05, **P<0.01, ***P<0.001. (D) Demonstrative photos showing the structure of ovary and bursa. (E) Illustrative pictures showing the surgical isolation of ovary and bursa, the isolated ovary and bursa were processed for RNA extraction respectively. (F, G) Real-time PCR examinations showed relative changes of Aqp2 (F) and Aqp5 (G) in isolated ovary and bursa at different time points after hCG injection. Relative expression levels for Aqp2 and Aqp5 were normalized between ovary and bursa. Statistics were made to compare the expression levels of different time points to 0 h for each tissue. *P<0.05, **P<0.01, ***P<0.001. n = 3 or 4 for each time point. Error bars represent S.E.M.

