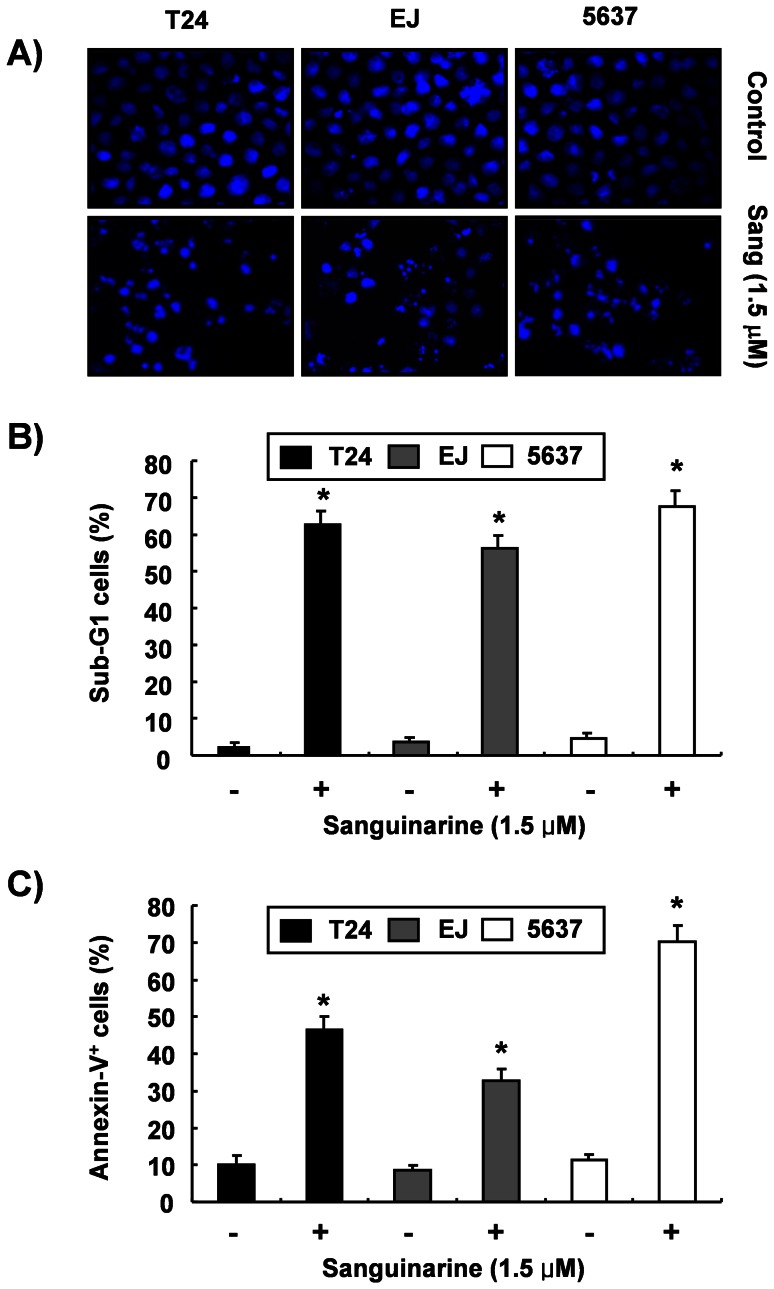
Figure 2. Induction of apoptosis by sanguinarine in the bladder cancer cells.
(A) The cells were incubated with 1.5 µM sanguinarine for 24 h and then stained with DAPI. The stained nuclei were then observed under a fluorescent microscope (magnification, ×400) using a blue filter. (B) To quantify the degree of apoptosis induced by sanguinarine, the cells were evaluated for sub-G1 DNA content using a flow cytometer. (C) The cells were stained with FITC-conjugated annexin-V and PI for flow cytometry analysis. The apoptotic cells were determined by counting the percentage of annexin V(+), PI(−) cells and the percentage of annexin V(+), PI(+) cells. Data are reported as means ± SD of three independent experiments. Significantly different from the control, *p<0.05.

