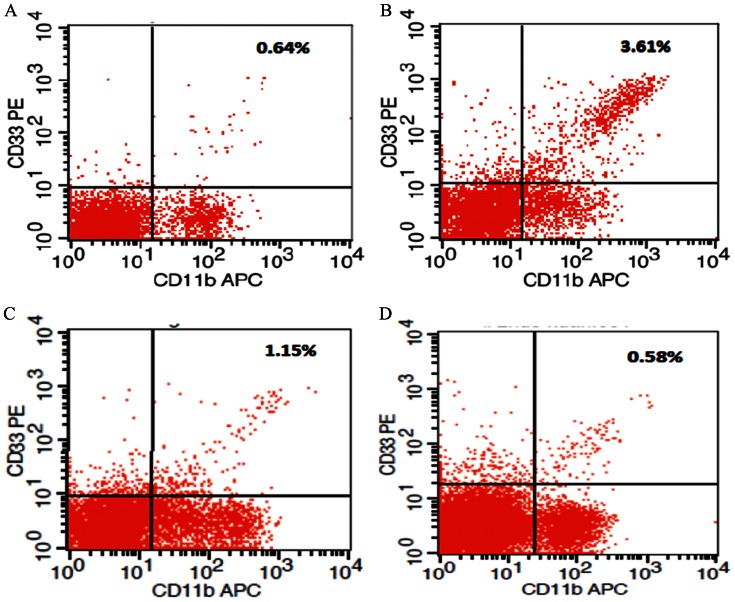
Figure 1. Representative flow cytometric analysis of the percentage of MDSCs in PBMCs in asthma patients, budesonide-treated asthma patients, healthy controls and pneumonia patients  .
.
(A) Percentage of MDSCs (CD11b+/CD33+) in PBMCs in the normal group. (B) Percentage of MDSCs in PBMCs in the attack asthma group. (C) Percentage of MDSCs in PBMCs in the budesonide treated group. (D) Percentage of MDSCs in PBMCs in the pneumonia group.

