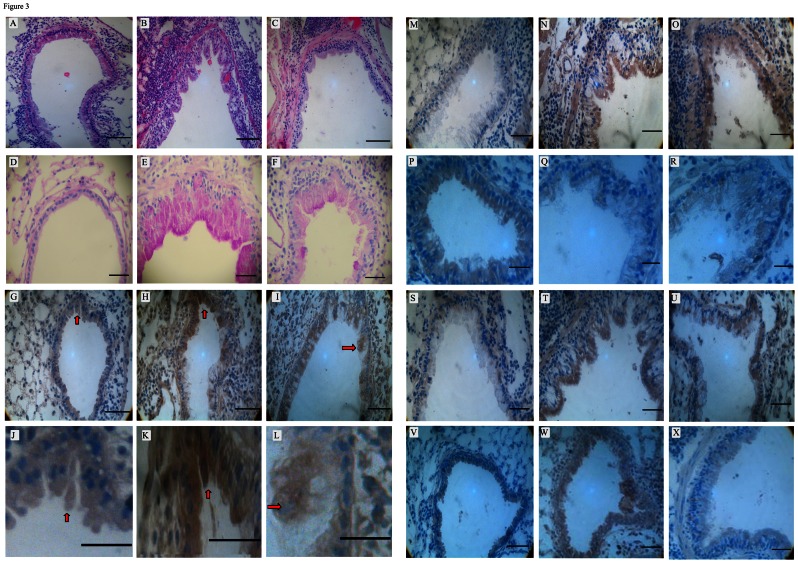
Figure 3. Different staining of the airway from normal controls (A, D, G, J, M, P, S, V), asthma mice (B, E, H, K, N, Q, T, W) and alleviated mice (C, F, I, L, O, R, U, X) and showed significant differences (Scale bars, 200 µm).
(A–C), Airway H&E staining on mice from three groups shows significant difference (×200); (D–F), The PAS staining of distinct mice show significant difference; (G–I), MDSCs IHC staining on mice from three groups shows significant difference (×200), arrows indicate positive staining; (J–L), higher magnification of MDSCs IHC staining; (M–O), IL-10 IHC staining on mice from three groups shows significant difference; (P–R), IL-12 IHC staining on mice from three groups shows significant difference (×200); (S–U), TNF-α IHC staining on mice from three groups shows significant difference (×200); (V–X), IL-6 IHC staining on mice from three groups shows significant difference (×200).

