
Figure 1. Representation of abdominal adiposity measures derived from computed tomography scans in the MrOS cohort.
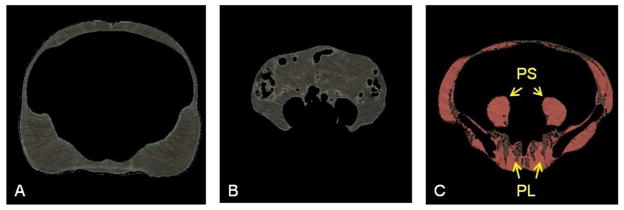
The morphologically discrete tissues measured during image processing are: A. subcutaneous adipose tissue which lies between the dermis and the fascia of the abdominal muscles; B. visceral adipose tissue which forms around the internal organs in the visceral cavity; and C. abdominal skeletal muscle (colored pink) and intermuscular adipose tissue (colored brown). The specific muscle groups denoted by yellow arrows are psoas muscles (PS) (lateral to the vertebral body) and paraspinal muscles (PL) (posterior to the vertebral body).