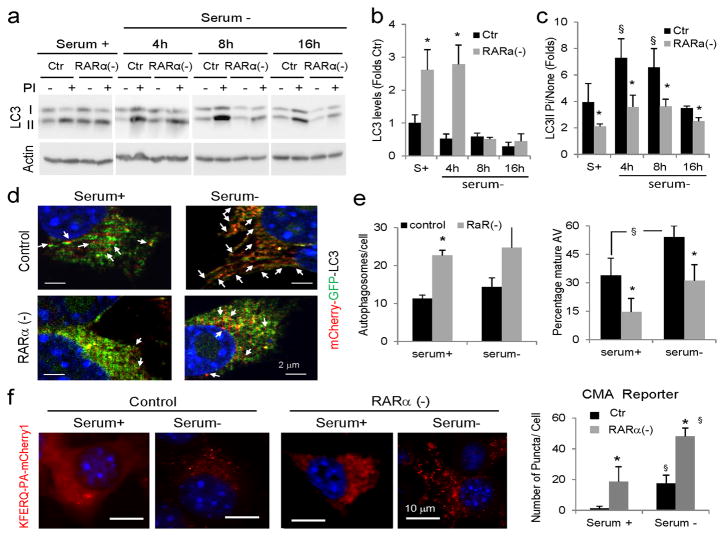
Figure 2. Effect of knockdown of RARα on autophagic pathways.
(a) Immunoblot for LC3-II of mouse fibroblasts control (ctr) or knocked-down for RARα (RARα(−)) maintained in the presence or absence of serum for the indicated times. Where indicated, protease inhibitors (PI) against lysosomal proteolysis were added. Actin is shown as loading control. (b) Levels of LC3-II determined by densitometric quantification of immunoblots. Values are expressed as folds values in serum supplemented control cells (n=4). (c) Ratio of levels of LC3-II in cells treated with PI compared to untreated cells. Values are expressed as fold untreated (n=4). (d,e) Autophagic flux in the same cells expressing mCherry-GFP-LC3 and maintained in the presence or absence of serum: (d) representative merged channels images. Arrows: autolysosomes (red); (e) Quantification of number of autophagosomes (mCherry and GFP positive) per cell (left) and percentage of autolysosomes (mCherry positive and GFP negative; right) in > 50 cells in at least 4 different fields. (f) Control and RARα(−) cells were transfected with the KFERQ-mcherry1 photoactivable reporter and after photoactivation were maintained in media with or without serum. Left: representative images. Inset show higher magnification images. Right: Quantification of the number of puncta per cell in > 50 cells in at least 4 different fields. Nuclei are labeled with DAPI. All values are mean±S.E. Differences with control (*) or with serum supplemented cells (§) are significant for p<0.05. Full-field fluorescence images and full-length blots are shown in Supplementary Figures 2 and 21, respectively.

