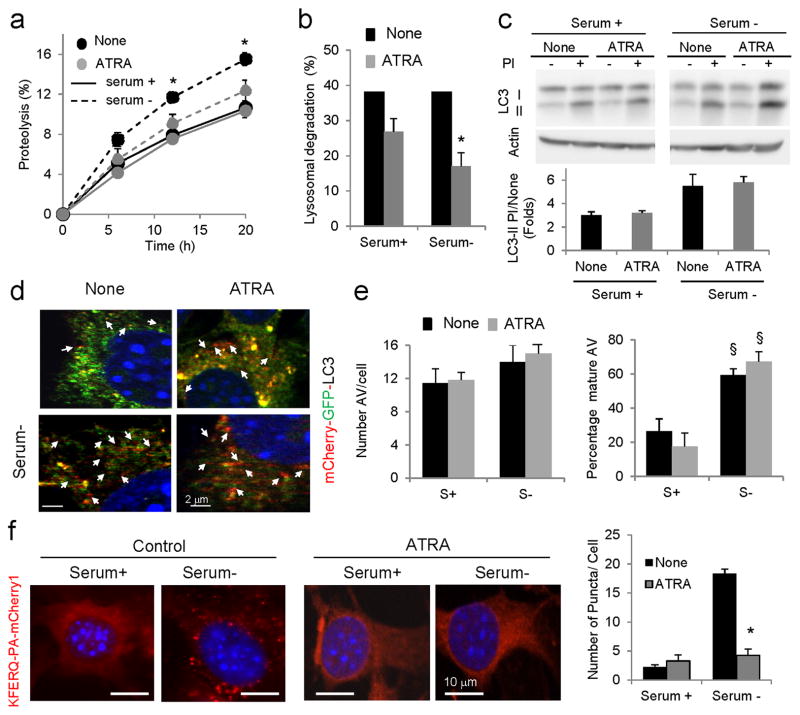
Figure 3. Effect of ATRA on autophagy.
(a) Rates of degradation of long-lived proteins in mouse fibroblasts untreated (None) or treated with (40μM) ATRA and maintained in the presence or absence of serum. Values are expressed as a percentage of proteolysis. (n=3) (b) Percentage of lysosomal degradation calculated after treatment with inhibitors of lysosomal proteolysis for 12 h (n=3). (c) Immunoblot for LC3-II of the same cells maintained in the presence or absence of serum and protease inhibitors (PI). Left: representative immunoblot. Actin is shown as loading control. Bottom: Ratio of levels of LC3-II in cells treated with PI compared to untreated cells. Values are expressed as fold untreated (n=4). (d, e) Autophagic flux in untreated and ATRA-treated cells expressing mCherry-GFP-LC3 and maintained in the presence or absence of serum: (d) representative merged channels images. Arrows: autolysosomes (red); (e) Number of autophagosomes (left) and percentage of autolysosomes (right) after quantification of > 50 cells. (f) Mouse fibroblasts expressing the KFERQ-mcherry1 photoactivable reporter with or without ATRA and after photoactivation maintained in the presence or absence of serum. Left: Representative images. Nuclei are labeled with DAPI. Insets: high magnification images. Right: Quantification of the number of puncta per cell in > 50 cells. All values are mean±S.E. and differences with untreated (*) or with serum-supplemented cells (§) are significant for p<0.01. Full-field fluorescence images and full-length blots are shown in Supplementary Figures 3 and 21, respectively.

