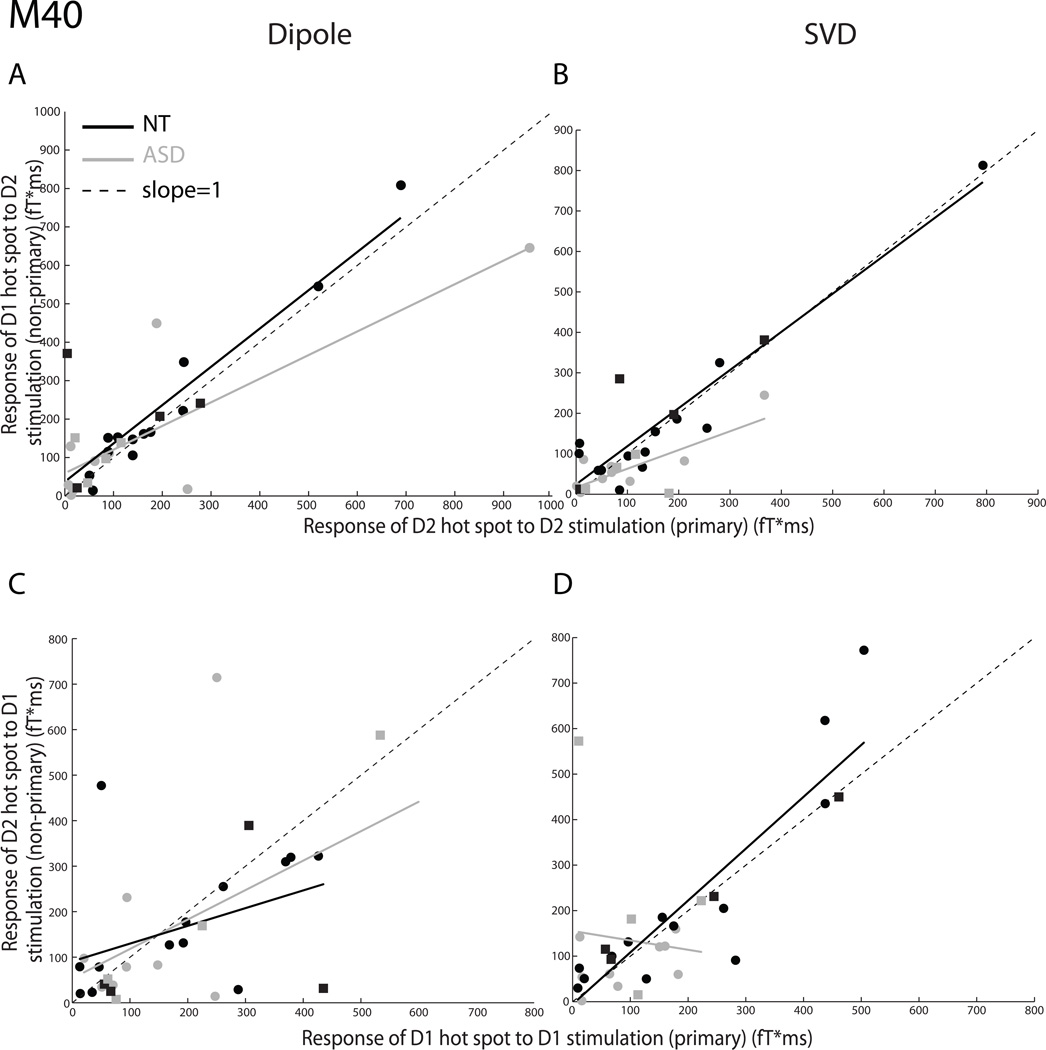
Fig. 1.
The short-latency M40 cortical response of the autism spectrum disorder (ASD) and neurotypical (NT) groups to adjacent digit stimulation. All somatosensory evoked fields (SSEFs) were computed using either dipole source modeling (Fig. 1A and 1C on the left) or singular value decomposition (Fig. 1B and 1D on the right). SSEF magnitude corresponding to the cortical representation of the adjacent, non-primary digit is plotted (ordinate) with respect to SSEF magnitude corresponding to the cortical representation of the stimulated, primary digit (abscissa). Each point represents a single participant (ASD: gray; NT: black; males: circles; females: squares). Non-primary/primary SSEF response ratios were plotted and linearly fitted (ASD group: solid gray lines; NT group: solid black lines); the resulting slopes for the ASD and NT groups were compared to a slope of 1.0 (dotted line) and to each other. A, B. D1/D2 SSEF ratios in response to the tactile stimulation of D2 are shown. C, D. D2/D1 SSEF ratios in response to the tactile stimulation of D1 are shown.

