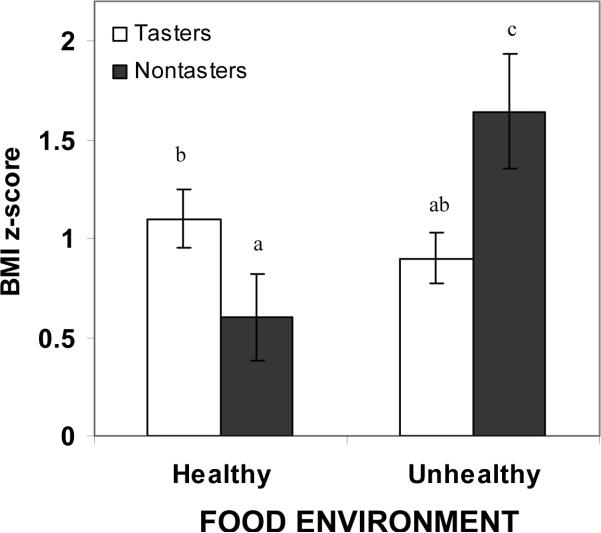
Figure 3.
Mean ± SE BMI z-score for tasters (white bars) and non-tasters (black bars) living in healthy and unhealthy food environments. Mean ± SD for tasters vs. non-tasters living in healthy environments were 1.1 ± 0.8 and 0.6 ±0.9, respectively. Mean ± SD for tasters vs. non-tasters living in unhealthy food environments were 0.9 ± 1.0 and 1.6 ± 1.1, respectively. Letters above graphs are used to signify significant differences in BMI z-score as a function of PROP status, food environment, and their interaction F(df)=8.2 (1,94); interaction effect p<0.005), with different letters used to denote differences between means (e.g. “a” is different from “b”). Sheffé post-hoc tests revealed that non-tasters living in unhealthy food environments (n=17) had higher BMI z-scores than tasters living in both healthy (n=38) (n=38;p<0.01) and unhealthy food environments (n=47) (n=47;p<0.005), and non-tasters living in healthy (n=18) (n=17;p<0.005) food environments.

