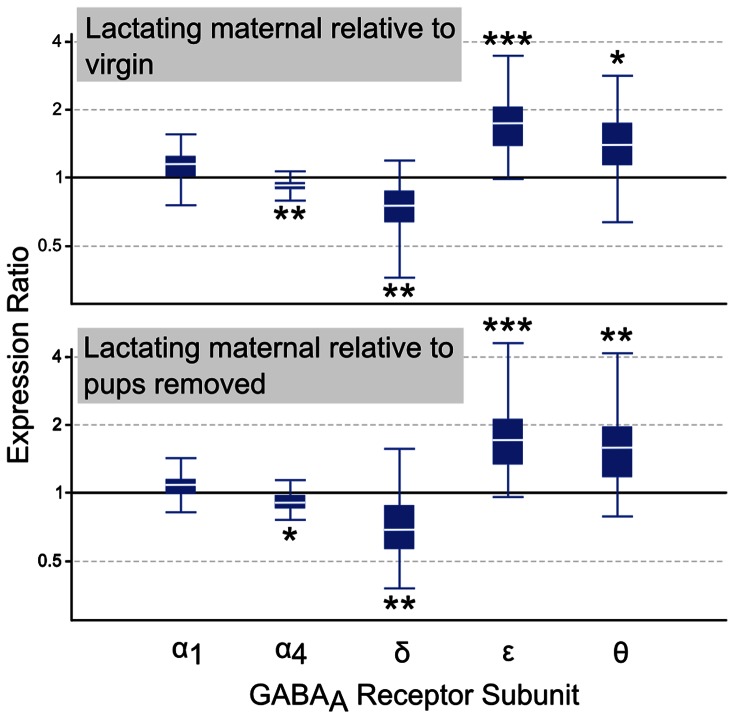
Figure 2. Quantitative real-time PCR analysis of GABAA receptor subunit expression in lateral septum.
Relative expression distribution (Y-axis) represented as a ratio of lactating maternal versus virgin (top panel, n = 8/group) and lactating maternal versus pups removed (bottom panel, n = 8/group), was normalized against two reference genes, Ppia and Ywhaz, and shown by box-and-whisker plots as medians (white lines), interquartile ranges (boxes), and ranges (whiskers). Ratios over one indicate genes that are more highly expressed in lactating maternal LS than in virgin or pups removed LS. *p<0.05; **p<0.01; ***p<0.001.

