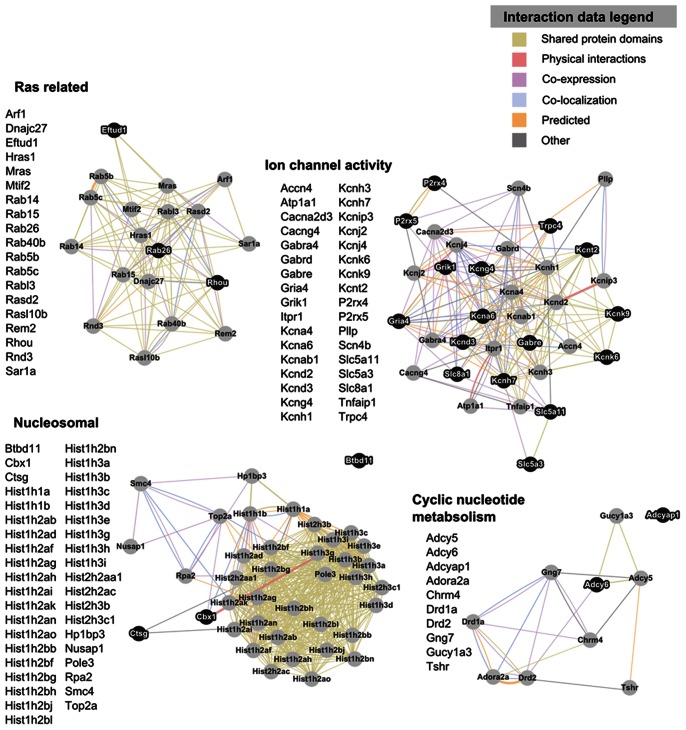
Figure 4. Gene clusters found to be enriched in the LS of lactating maternal mice relative to virgin mice as interaction networks.
Gene lists for each cluster are presented to the left of their respective network visualization. Gene symbols in bold text are upregulated in lactating maternal LS relative to virgin, and are represented in the network images as dark nodes with white text. Non-bold gene symbols and grey nodes with dark text correspond to genes that are downregulated. The nature of the interaction data linking any two nodes is encoded by color. Distance between nodes is proportional to the strength of evidence for their interactions.

