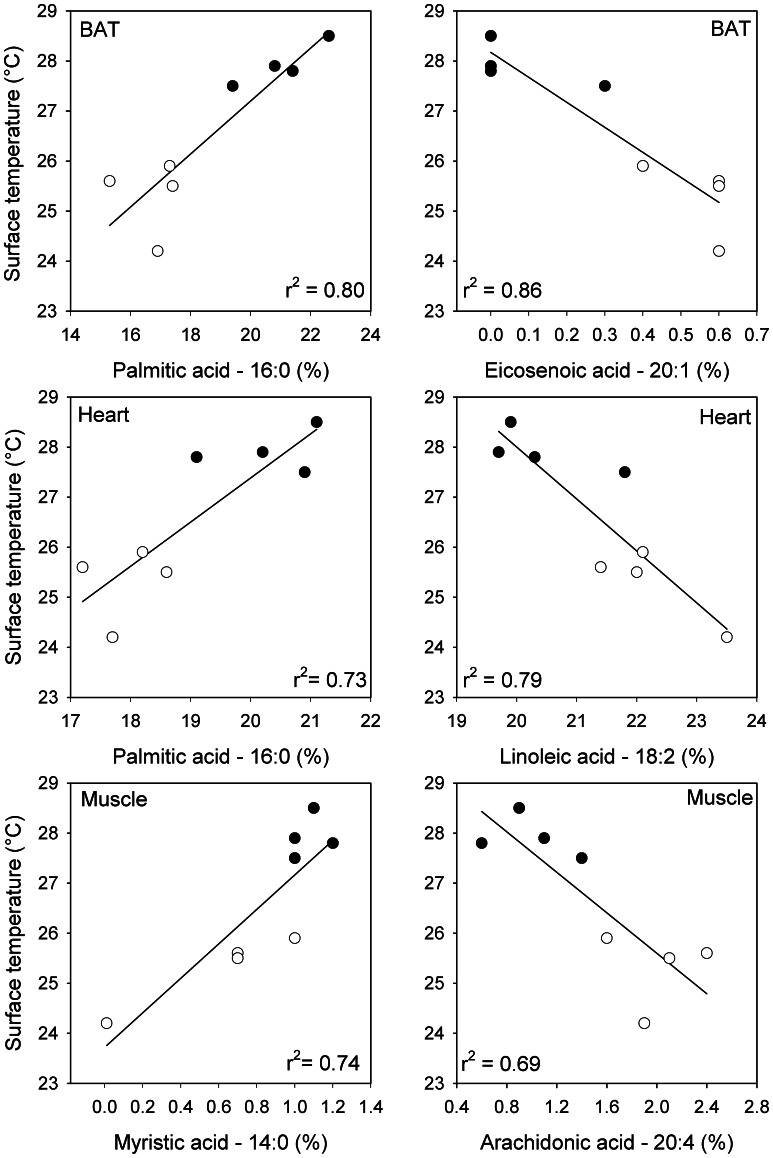
Figure 2. Linear regressions of mean surface temperature (Ts) of individual P. sungorus as a function of fatty acid percent.
Equations are provided in Table 6 and the two regressions with the greatest r2–values for each tissue are shown. Black dots represent long photoperiod (LP) hamsters, circles represent short photoperiod (SP) hamsters.

