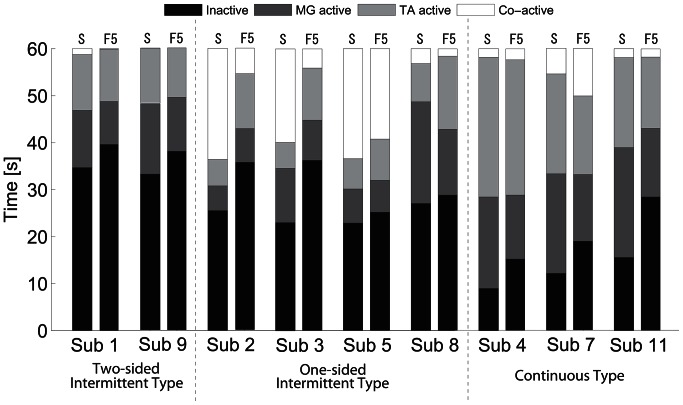
Figure 5. Average durations of inactive, TA-active, MG-active and co-active intervals.
See caption of Fig. 4 for definitions of four groups of intervals. Each duration was averaged separately over the first five trials (F5) and the successful trials (S) for each subject. Black bars: Inactive durations. Dark gray bars: MG-active durations. Gray bars: TA-active durations. White bars: Co-active durations.

