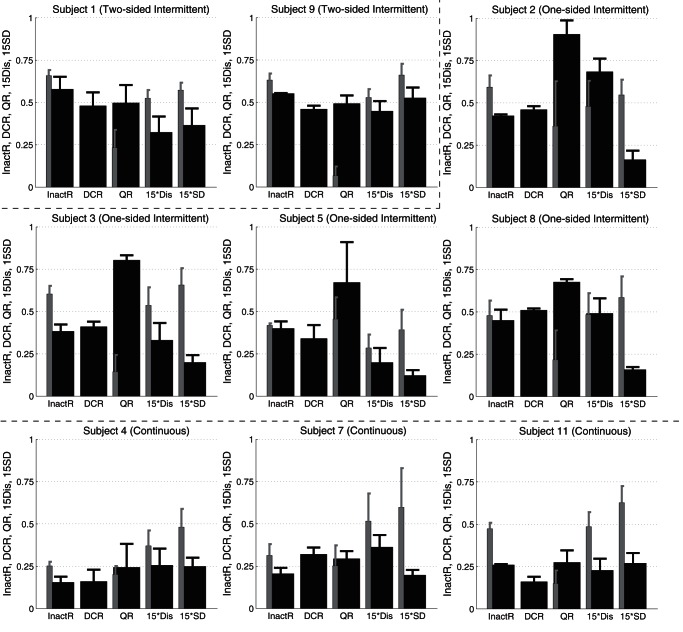
Figure 7. Multiple indices characterizing sway of the virtual inverted pendulum for each subject.
In each panel, values of five indices are plotted as thick black bars. From the left-most index, they represent the ratio of inactive interval to the whole trial time span (Inactive-Ratio) denoted as InactR, the ratio of time interval with DC to the whole single trial time span (DC-Ratio) denoted as DCR, the ratio of the number of off-points (an off-point is a state point at a time instant when an inactive interval began) located in specific areas of the 2nd and the 4th quadrants of the phase plane to the total number of off-points (Q-Ratio) denoted as QR, the average of distance between off-points and the
  -axis in the phase plane denoted as Dis (15 times of Dis-value for scaling: 15Dis), and the average standard deviation of
  -coordinates of off-points denoted as SD (15 times of SD for scaling: 15SD). See text for detailed definitions of indices. Thick black bars are for average values of the indices for successful trials. Thin gray bars are the corresponding values for F5 trials. See text for the meaning of configuration of panels for nine subjects.

