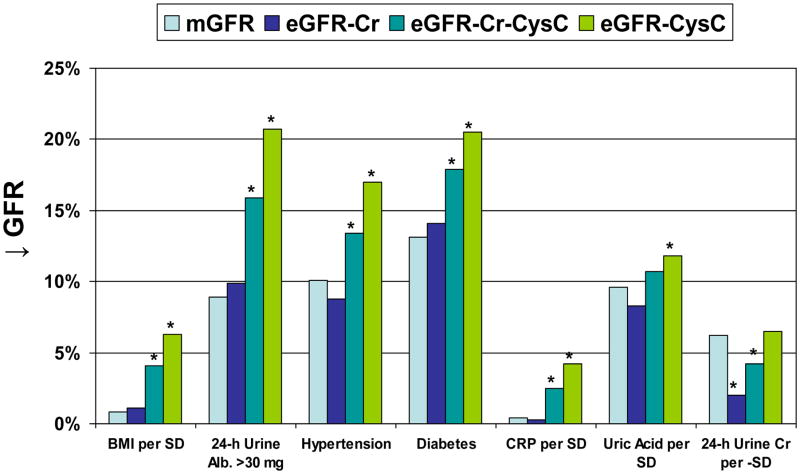
Figure 3.
The association of CKD risk factors with percentage decrease in GFR (↓ GFR) by each method (mGFR, eGFRCr, eGFRCr-CysC, and eGFRCysC). The * identifies p<0.05 for eGFR compared to mGFR using model 1 (generalized estimating equations). Risk factor associations with mGFR were more similar to those with eGFRCr than with eGFRCr-CysC or eGFRCysC. The one exception was 24-h urine creatinine where eGFRCysC was more similar to the same association with mGFR.

