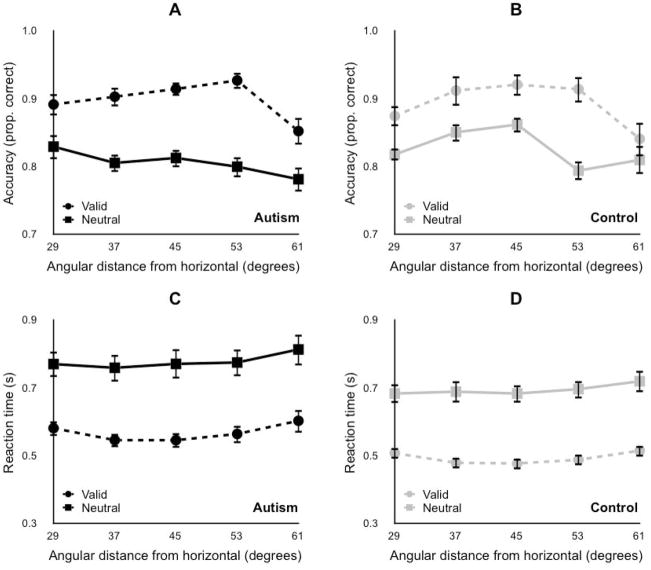
Figure 3. High spatial uncertainty.
Experiment 3, short SOA. (A) and (B) Accuracy in orientation discrimination task. (C) and (D) Reaction time in orientation discrimination task. (A) and (C) Autism group. (B) and (D) Typically developing control group. Horizontal axis in each panel, target location. Squares with solid line, neutral trials. Circles with dashed line, valid trials. Error bars, SEM across participants.

