
Fig. 2.
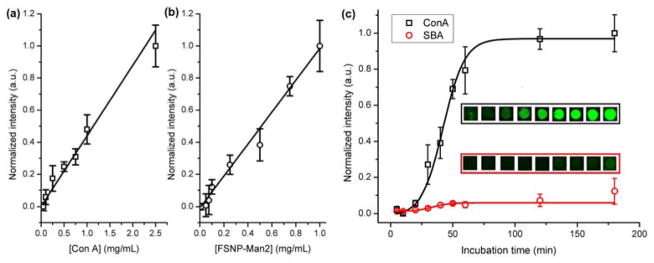
Interactions of FSNP-Man2 with the lectin super-microarray: (a) fluorescence intensity vs. the printing concentration of Con A (□); (b) fluorescence intensity vs. the concentration of FSNP-Man2 (○); (c) fluorescence intensity vs. the incubation time with FSNP-Man2 (inserts: fluorescence images of Con A spots (top panel) and SBA spots (bottom panel). The concentrations of FSNP-Man2 in (a) and (c) were 1.5 mg/mL, and the printing concentration of Con A in (b) was 1 mg/mL. Each data point was the average of the five duplicate spots on the array. Lines were drawn solely to guide the eye.