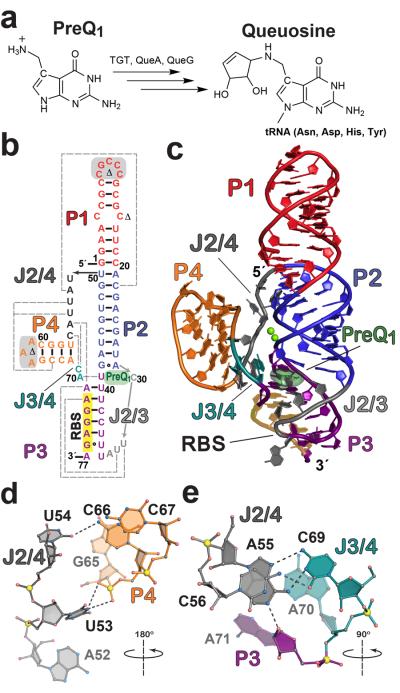
Figure 1. Queuosine biosynthesis, secondary structure, and tertiary fold of the L. rhamnosus preQ1-II riboswitch.
(a) Queuosine biosynthesis from preQ1 with known enzymes shown. Although animals must obtain Q from dietary sources or gut flora, bacteria can produce it by de novo synthesis (reviewed in 21, 22). TGT, tRNA:guanine transglycosylase; QueA, epoxyqueuosine synthase; and QueG, oQ (epoxyqueuosine) reductase (b) Secondary structure of the wild type L. rhamnosus preQ1-II riboswitch used in this investigation based on the crystal structure. PreQ1 is dark green; various pairing regions, P, are color coded with long-range interactions indicated by dashed gray lines; junctions are labeled J. Sites modified for crystallization are highlighted in gray or marked with a Δ. See Supplementary Fig. 1 for the modified construct (MC) used in crystallization and isothermal titration calorimetry (ITC); numbering is based on the MC 77-mer sequence. The consensus RBS sequence 5′-AGGAG-3′ is highlighted in yellow. (c) Cartoon depiction of the preQ1-bound crystal structure. Coloring is the same as b with the preQ1 effector depicted as a semitransparent surface model. The RBS is labeled and highlighted in yellow. (d) Hydrogen-bond tertiary interactions (dashed lines) between P4 and J2/4 that stabilize the core fold; the view is rotated ~180° about the axis shown, relative to the orientation in c. (e) Tertiary interactions that knit together J2/4, J3/4, and A71 of the three-way helical junction; the view is rotated ~90° about the indicated axis relative to c.

