
Figure 2. Architecture of the effector binding site and tertiary interactions involved in preQ1-II riboswitch ligand recognition.
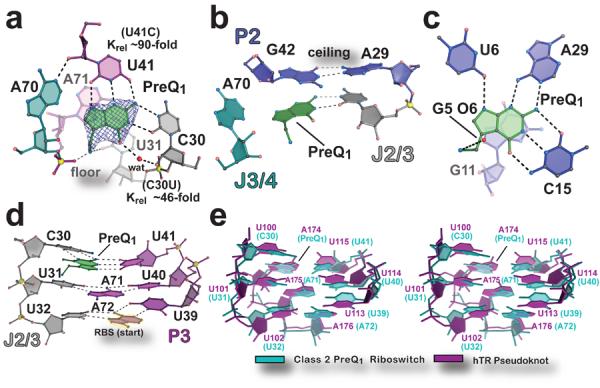
(a) View of the preQ1 ligand-binding site. The final refined ligand is covered by an unbiased Fo-Fc omit electron density map, contoured at the 3.0 σ level, that was calculated prior to inclusion of preQ1 in the model. The “floor” of the binding pocket is formed by a Hoogsteen base pair between A71•U31. Krel (KD mutant / KD wild type) of binding site mutants, determined by ITC, is shown next to the respective base. (b) The “ceiling” of the preQ1 binding pocket is formed by a cis-Watson-Crick/Watson-Crick base pair between G42 and A29. (c) The preQ1-I translational riboswitch in complex with preQ1 (PDB ID 3Q50)12. (d) Major-groove base triples that stack on the RBS to facilitate formation of the P3 pseudoknot. (e) Stereo view of an all-atom superposition between the eight nucleotides of the preQ1-II riboswitch base triples in d and equivalent base triples from the hTR pseudoknot (PDB ID 1YMO)19. The average rmsd was 1.46 Å (excluding hTR A174, which spatially overlaps preQ1).