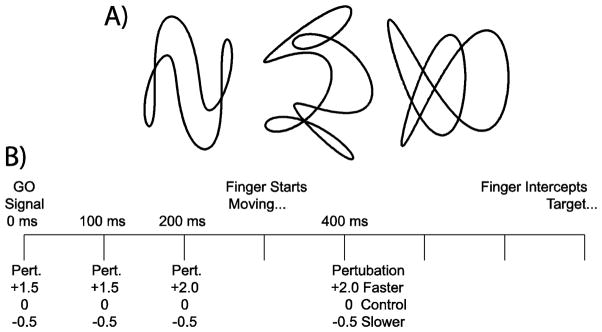
Figure 1.

Experimental design. A) The three target paths used for both interception and control sessions in the 100, 200 and 400 ms conditions are shown. These three paths were rotated (90° counterclockwise) and reversed (along the vertical axis) in 0 ms condition to prevent familiarity with the trajectories. B) The timeline indicates possible speed perturbation events for all experimental conditions. Fast or slow perturbations could occur at the same time as the GO signal (which is 0 ms throughout the text) or 100, 200 or 400 ms after. Subjects began the interception movement approximately 300 ms after the GO signal and if successful intercepted the target approximately 400 ms later.
