
Figure 4.
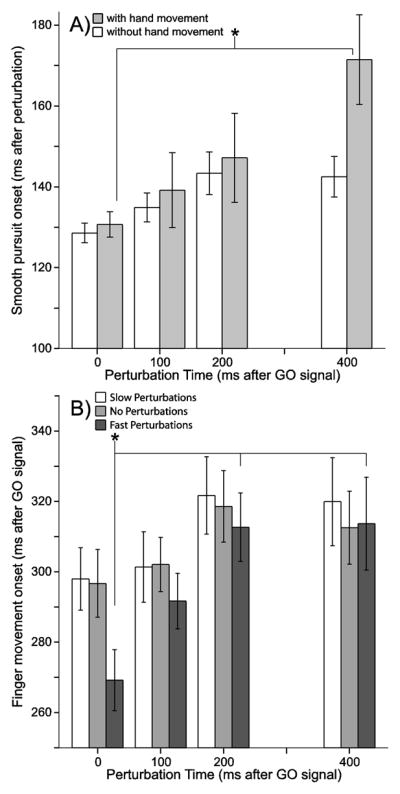
A) Quantification of reaction times (y-axis) for the response of smooth pursuit speed to a change in target speed for each perturbation time condition (x-axis). The shaded bars depict data from sessions with both eye and finger movement (interception sessions); the white bars refer to sessions which served as the eye-only control experiments (no finger movement). The white bars are not significantly different from each other. The shaded bar in the 400 ms perturbation condition is significantly different from that in the 0 ms perturbation condition. B) Reaction time (y-axis) for the finger interception movement for each perturbation time condition (x-axis) and for each perturbation magnitude (bar color coded). White bars represent data from the slow perturbation condition. Light gray bars represent the data from the no perturbation condition. Dark gray bars represent the data from fast perturbation conditions. The asterisked conditions are significantly different from each other (i.e. the 0 ms condition is different from the 200ms and 400ms conditions).