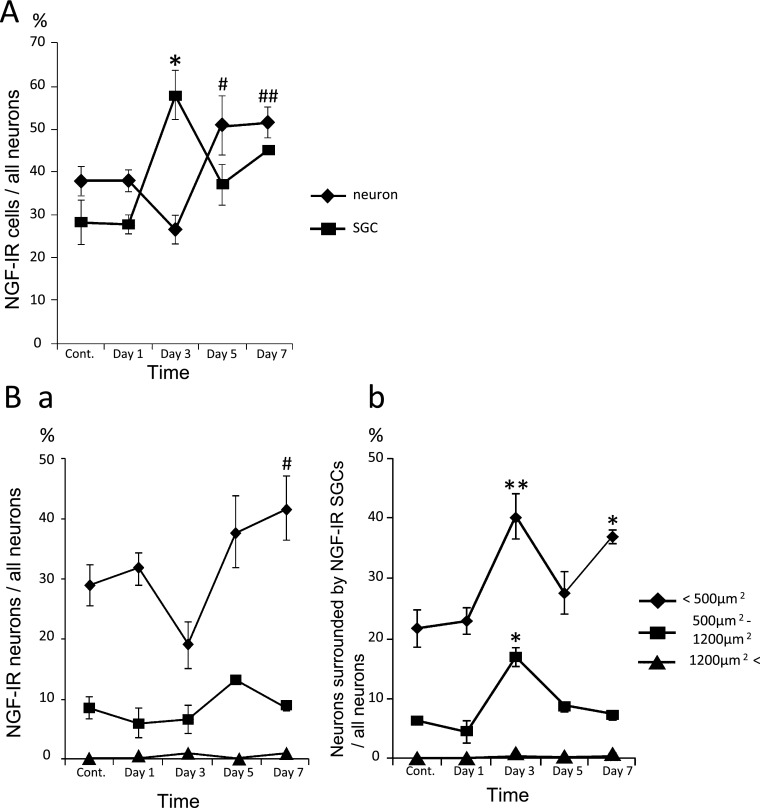
Fig. 5.
The ratio of NGF-IR neurons and neurons surrounded by NGF-IR satellite cells in the trigeminal ganglion. (A) The ratio of NGF-IR neurons and neurons surrounded by NGF-IR satellite cells per all neurons in the maxillary nerve region. (B) Ratios of small (<500 µm2), medium (500–1,200 µm2), and large (>1,200 µm2) NGF-IR neurons per all neurons in the maxillary nerve region (a). The ratio of small (<500 µm2), medium (500–1,200 µm2), and large (>1,200 µm2) neurons surrounded by NGF-IR satellite cells per all neurons in the maxillary nerve region (b). The results are the means±SEM. Control group n=4. Experimental group n=21. *P<0.05 **P<0.01 compared with control. #P<0.05, and ##P<0.01 compared with 3 days after the start of experimental tooth movement.

