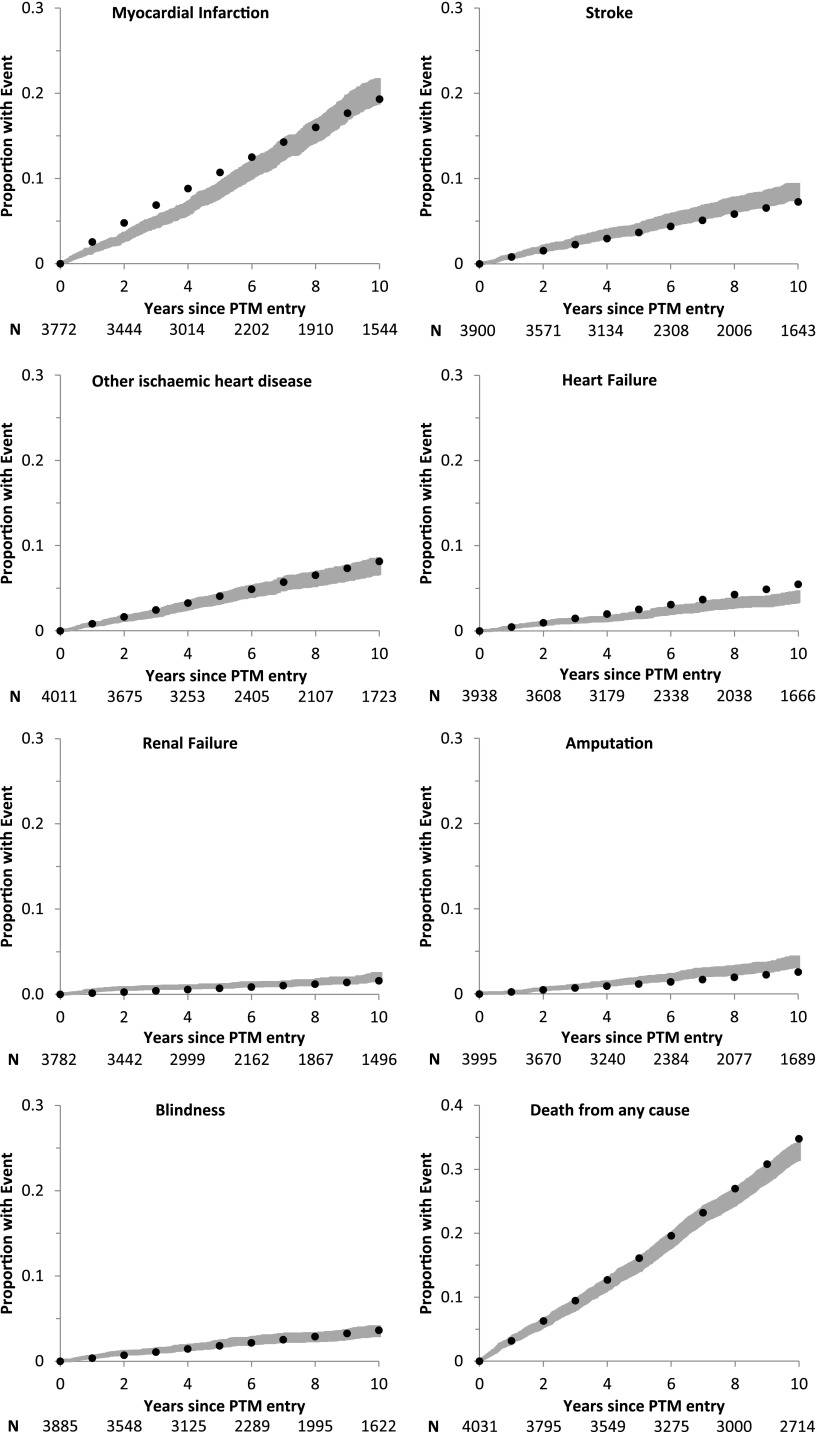
Figure 1.
Observed and predicted cumulative probabilities of failure of first complications in PTM period. PTM curve (gray) comprises the observed 95% CI. Kaplan-Meier plots of cumulative probability of failure of each complication are shown with the respective 95% CI. Model curve (●) comprises the mean predicted estimate for each complication (using life table approach) based on the model-predicted risk factors. The number at risk at 2-year intervals is shown (N). “Years since PTM entry” comprises the time since the date of entry into the study (1 October 1997) until death or the closing date of the study.

