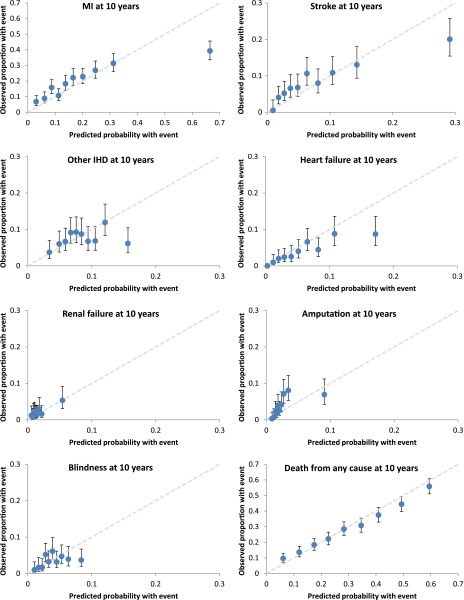
Figure 2.
Calibration plots per deciles of risk at 10 years. Circles indicate the observed cumulative failure per deciles of predicted risk for seven complications and death, with vertical lines representing observed 95% CI. Cumulative failure for each complication at year 10 of PTM was estimated using Kaplan-Meier analysis. Simulation results are based on the modeled risk factor time paths. The 45° line (gray) represents perfect correlation over all deciles of predicted risk. (A high-quality color representation of this figure is available in the online issue.)

