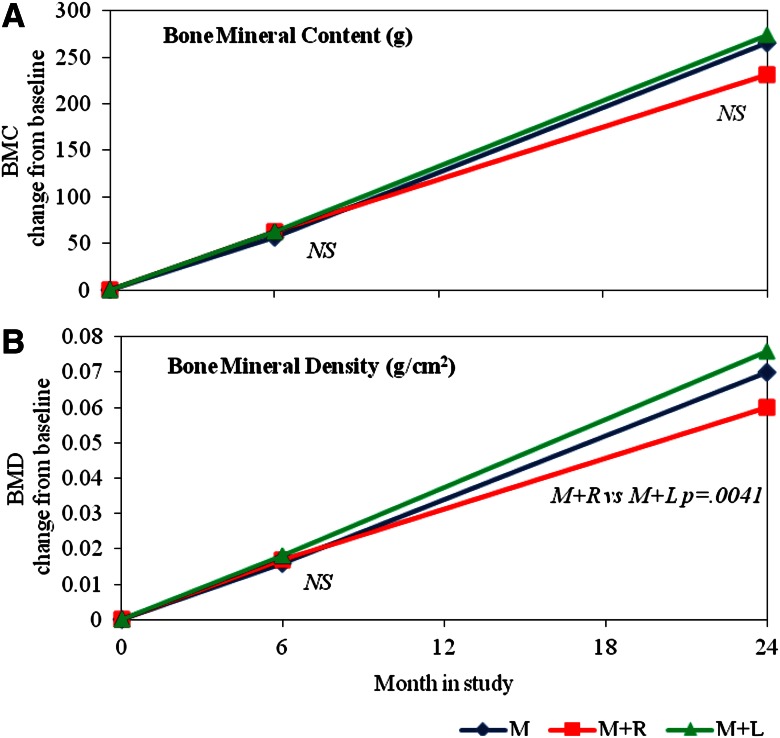
Figure 2.
LSmean change from baseline for BMC (g) (A) and BMD (g/cm2) (B) at 6 and 24 months, by treatment. Treatment groups are denoted by M, M+R, and M+L. LSmeans and P values are output from an analysis modeling BMC and BMD change from baseline (6–0 and 24–0) as a function of baseline value, treatment, period (0–6 or 0–24 months), height, and age at the time of visit, and the interaction of treatment by period. Significant treatment group differences for the 6- and 24-month change from baseline are indicated within the figure (nonsignificant differences are indicated by NS).

