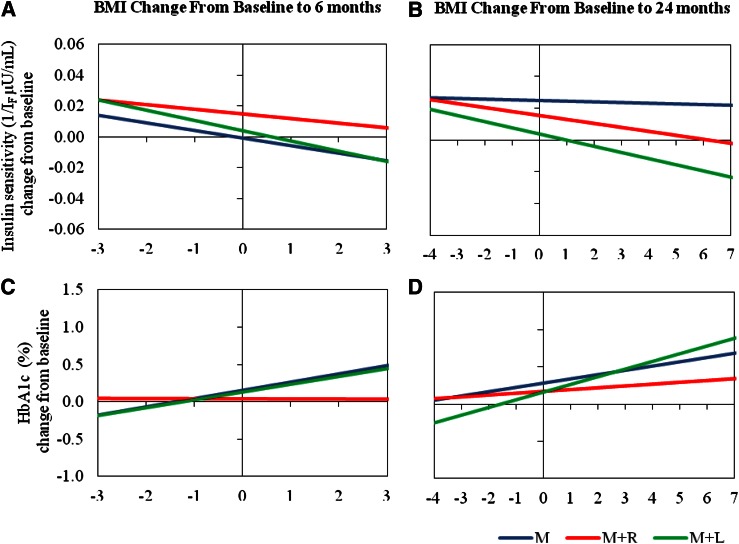
Figure 3.
Regression lines of change from baseline for insulin sensitivity (1/IF µU/mL) versus BMI change, from baseline to 6 months (A) and baseline to 24 months (B); and regression lines of change from baseline for HbA1c (%) vs. BMI change, from baseline to 6 months (C) and baseline to 24 months (D), by treatment. Treatment groups are denoted by M, M+R, and M+L. The horizontal axis scales represent the 5th–95th percentiles of the distribution of BMI change from baseline (−3 to 3 at 6 months and −4 to +7 at 24 months). Note that the 5th–95th percentile range of BMI change from baseline is greater for the 24-month period than for the 6-month one. Slopes indicate change in insulin sensitivity or HbA1c per unit increase in BMI change and were evaluated from models including the baseline value of either insulin sensitivity or HbA1c as a covariate.

