
Fig. 1.
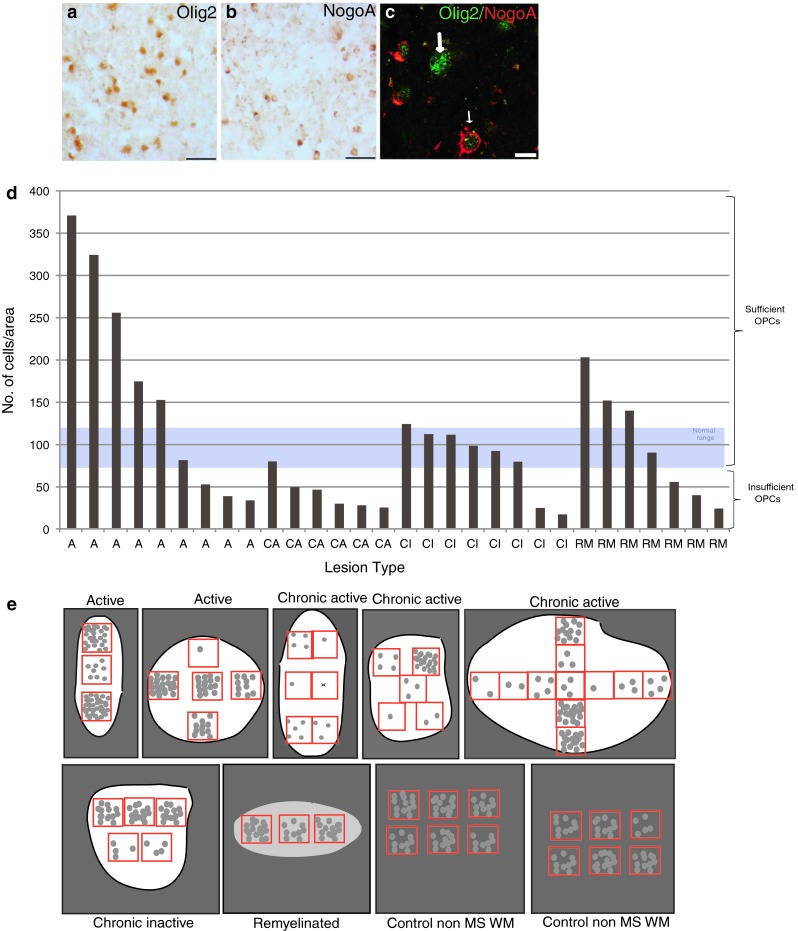
Different human MS lesions contain different numbers of OPCs. Colorimetric staining of an active MS lesion showing a Olig2+ cells, b NogoA+ cells and c immunofluorescence showing dual labelling (Olig2 in green and NogoA in red). The thick arrow shows an Olig2+ cell and the thin arrow a dual labelled cell. Scale bar a and b 40 μm c 10 μm. d Bar graph of average OPC number per lesion area, with one bar per lesion, showing the variation between pathological subtypes, with fewer OPCs in the chronic active lesions. The normal range of numbers of OPC in the brain was defined as the mean ± one standard deviation of OPC counts from 35 fields of view from 5 blocks from 5 different postmortem brains where death was due to a non-neurological cause. e Schematic showing the variability of OPC number in different regions of single lesions represented as white (for demyelinated lesions) or pale grey areas (for remyelinated lesions) compared with white matter of control non-MS brain tissue. Red boxes represent fields of view counted, and 1 grey circle represents 10 OPCs