
Figure 10.
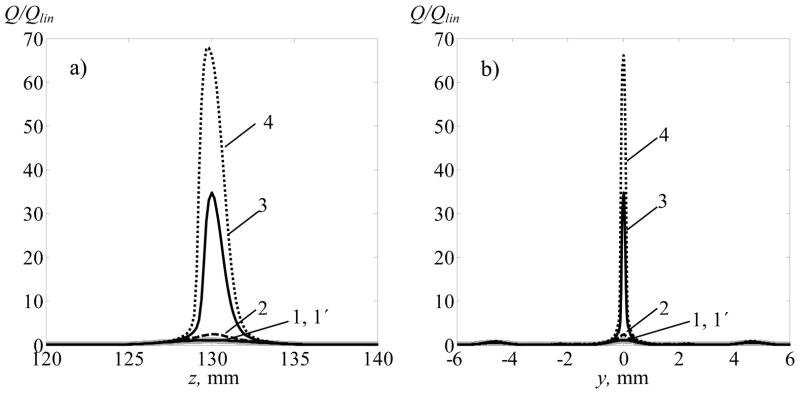
Distribution of heat deposition rate along the z-axis (a) and in the focal plane (b) along the y-axis (x = 0). The distributions were calculated using the linear approximation (grey bold curves 1) and accounting for nonlinearity for I0 = 2.5 W·cm−2 (1′), I0 = 20 W·cm−2 (2), I0 = 30 W·cm−2 (3) and I0 = 40 W·cm−2 (4).