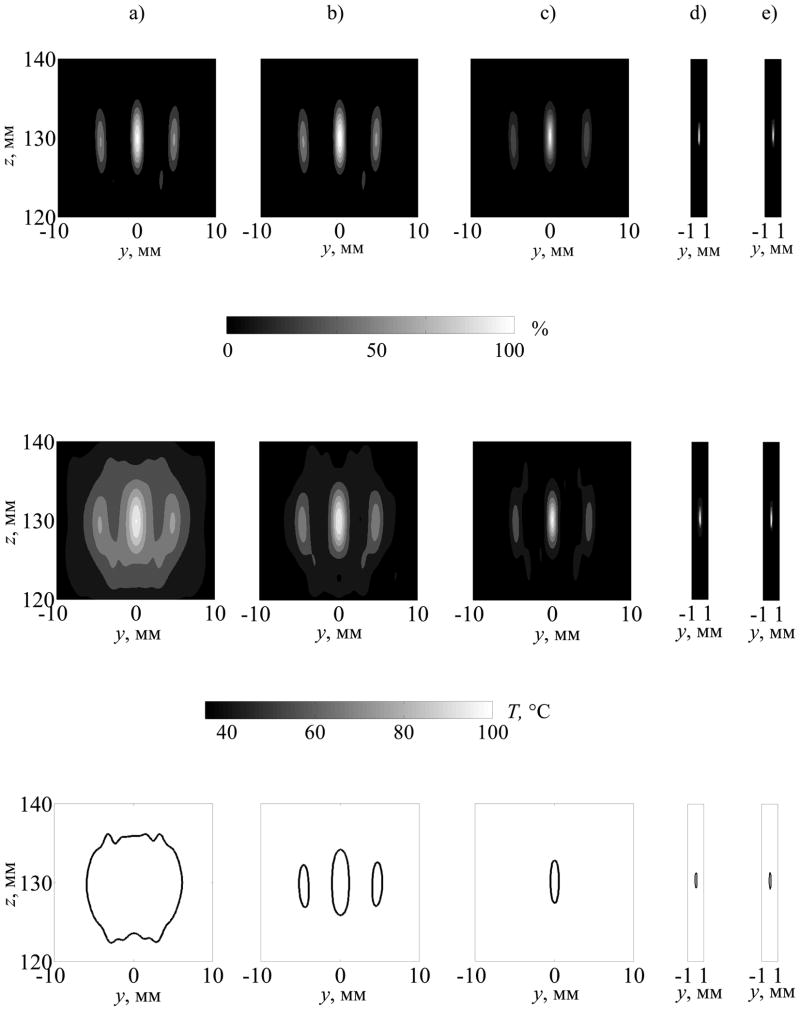
Figure 11.
Spatial distributions of the heating rate Q/Qmax normalized to the maximum value of the corresponding distributions (upper row), temperature distributions T°C (middle row), and contours of thermal lesions in tissue (bottom row) at the time when the temperature in the center of the main focus reaches 100°C. Initial intensity at the array element front faces is: I0 = 2.5 W/cm2 (a), 5 W/cm2 (b), 20 W/cm2 (c), 30 W/cm2 (d), 40 W/cm2 (e).

