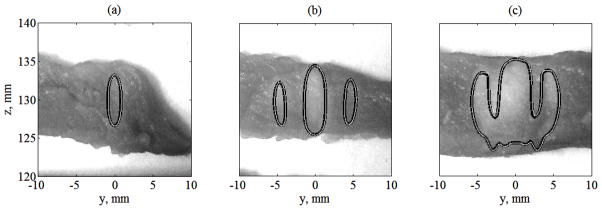
Figure 12.

Contours of lesions modeled in the axial plane (x = 0) super-imposed on the images of lesions produced in ex vivo tissue samples. The contours were calculated using linear (dark curves) and nonlinear (thin white curves) acoustic modelling at I0 = 2.5 W·cm−2 after 5 s (a), 10 s (b) and 15 s (c) of heating.
